Polish vs Nonimmigrants Median Female Earnings
COMPARE
Polish
Nonimmigrants
Median Female Earnings
Median Female Earnings Comparison
Poles
Nonimmigrants
$40,371
MEDIAN FEMALE EARNINGS
80.2/ 100
METRIC RATING
148th/ 347
METRIC RANK
$37,024
MEDIAN FEMALE EARNINGS
0.4/ 100
METRIC RATING
267th/ 347
METRIC RANK
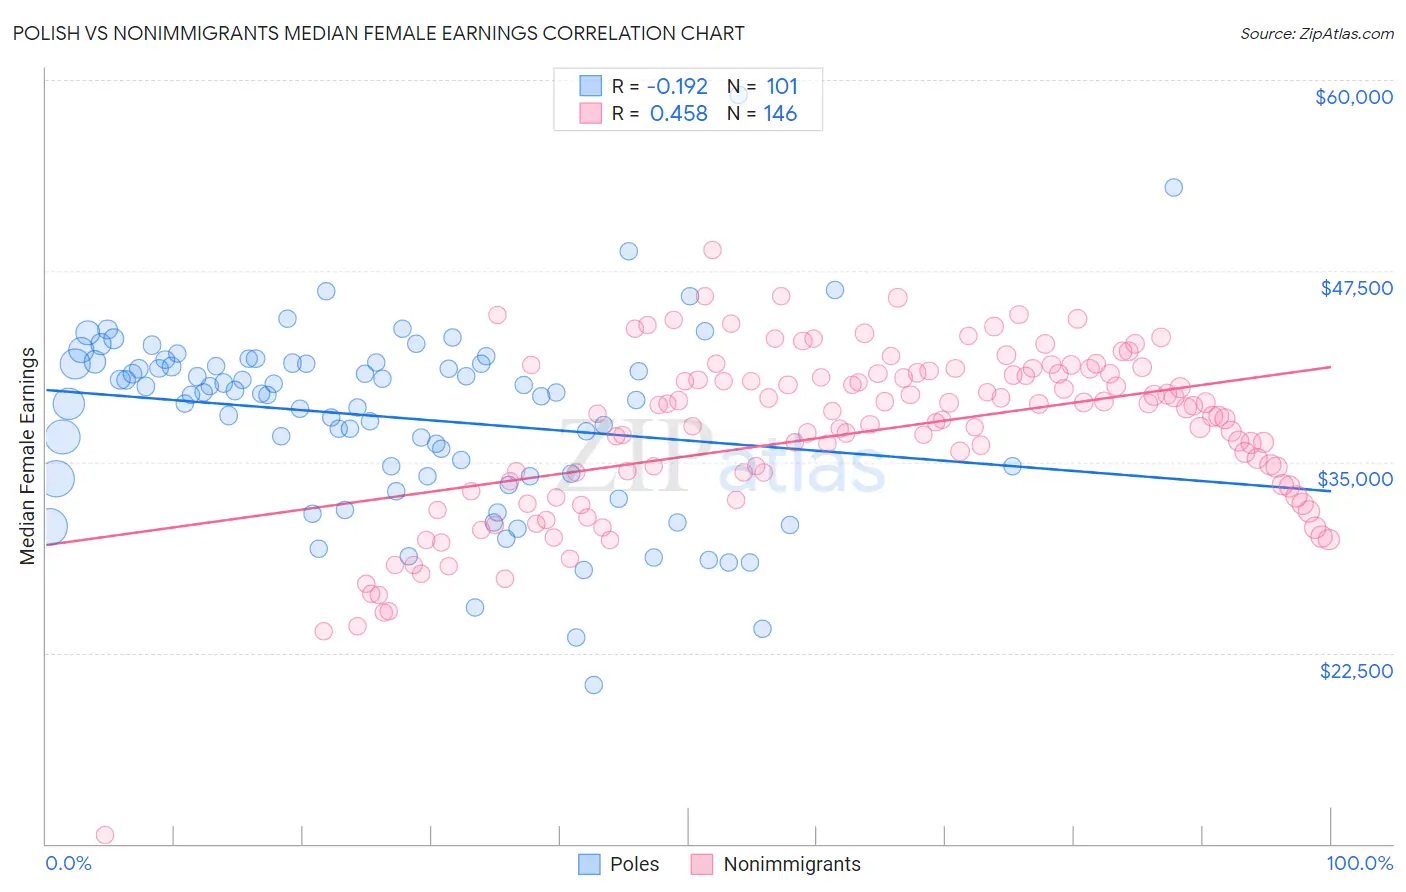
Polish vs Nonimmigrants Median Female Earnings Correlation Chart
The statistical analysis conducted on geographies consisting of 559,155,660 people shows a poor negative correlation between the proportion of Poles and median female earnings in the United States with a correlation coefficient (R) of -0.192 and weighted average of $40,371. Similarly, the statistical analysis conducted on geographies consisting of 581,449,824 people shows a moderate positive correlation between the proportion of Nonimmigrants and median female earnings in the United States with a correlation coefficient (R) of 0.458 and weighted average of $37,024, a difference of 9.0%.
Median Female Earnings Correlation Summary
| Measurement | Polish | Nonimmigrants |
| Minimum | $20,398 | $10,532 |
| Maximum | $59,044 | $48,847 |
| Range | $38,646 | $38,315 |
| Mean | $37,935 | $36,884 |
| Median | $39,430 | $38,067 |
| Interquartile 25% (IQ1) | $34,072 | $33,375 |
| Interquartile 75% (IQ3) | $41,456 | $40,787 |
| Interquartile Range (IQR) | $7,385 | $7,412 |
| Standard Deviation (Sample) | $6,072 | $5,653 |
| Standard Deviation (Population) | $6,042 | $5,634 |
Similar Demographics by Median Female Earnings
Demographics Similar to Poles by Median Female Earnings
In terms of median female earnings, the demographic groups most similar to Poles are Vietnamese ($40,377, a difference of 0.020%), Immigrants from Cameroon ($40,354, a difference of 0.040%), Immigrants from Chile ($40,353, a difference of 0.040%), Immigrants from Armenia ($40,340, a difference of 0.080%), and West Indian ($40,317, a difference of 0.13%).
| Demographics | Rating | Rank | Median Female Earnings |
| Immigrants | Syria | 84.1 /100 | #141 | Excellent $40,499 |
| Sri Lankans | 84.0 /100 | #142 | Excellent $40,496 |
| Northern Europeans | 83.9 /100 | #143 | Excellent $40,491 |
| Immigrants | North Macedonia | 83.8 /100 | #144 | Excellent $40,488 |
| Brazilians | 83.6 /100 | #145 | Excellent $40,483 |
| Ghanaians | 82.1 /100 | #146 | Excellent $40,429 |
| Vietnamese | 80.4 /100 | #147 | Excellent $40,377 |
| Poles | 80.2 /100 | #148 | Excellent $40,371 |
| Immigrants | Cameroon | 79.7 /100 | #149 | Good $40,354 |
| Immigrants | Chile | 79.6 /100 | #150 | Good $40,353 |
| Immigrants | Armenia | 79.2 /100 | #151 | Good $40,340 |
| West Indians | 78.4 /100 | #152 | Good $40,317 |
| British West Indians | 77.7 /100 | #153 | Good $40,299 |
| Immigrants | Oceania | 77.6 /100 | #154 | Good $40,297 |
| Immigrants | Africa | 76.2 /100 | #155 | Good $40,257 |
Demographics Similar to Nonimmigrants by Median Female Earnings
In terms of median female earnings, the demographic groups most similar to Nonimmigrants are Cree ($37,018, a difference of 0.010%), Dominican ($37,046, a difference of 0.060%), Immigrants from Venezuela ($37,003, a difference of 0.060%), Immigrants from Belize ($37,056, a difference of 0.090%), and Salvadoran ($37,083, a difference of 0.16%).
| Demographics | Rating | Rank | Median Female Earnings |
| Dutch | 0.7 /100 | #260 | Tragic $37,339 |
| Malaysians | 0.7 /100 | #261 | Tragic $37,298 |
| Venezuelans | 0.7 /100 | #262 | Tragic $37,282 |
| German Russians | 0.5 /100 | #263 | Tragic $37,105 |
| Salvadorans | 0.4 /100 | #264 | Tragic $37,083 |
| Immigrants | Belize | 0.4 /100 | #265 | Tragic $37,056 |
| Dominicans | 0.4 /100 | #266 | Tragic $37,046 |
| Immigrants | Nonimmigrants | 0.4 /100 | #267 | Tragic $37,024 |
| Cree | 0.4 /100 | #268 | Tragic $37,018 |
| Immigrants | Venezuela | 0.4 /100 | #269 | Tragic $37,003 |
| French American Indians | 0.3 /100 | #270 | Tragic $36,920 |
| Nicaraguans | 0.3 /100 | #271 | Tragic $36,904 |
| Immigrants | Dominican Republic | 0.3 /100 | #272 | Tragic $36,857 |
| Immigrants | Laos | 0.3 /100 | #273 | Tragic $36,841 |
| Immigrants | El Salvador | 0.2 /100 | #274 | Tragic $36,673 |