Yaqui vs Immigrants from Ghana Per Capita Income
COMPARE
Yaqui
Immigrants from Ghana
Per Capita Income
Per Capita Income Comparison
Yaqui
Immigrants from Ghana
$36,112
PER CAPITA INCOME
0.0/ 100
METRIC RATING
315th/ 347
METRIC RANK
$41,131
PER CAPITA INCOME
5.5/ 100
METRIC RATING
227th/ 347
METRIC RANK
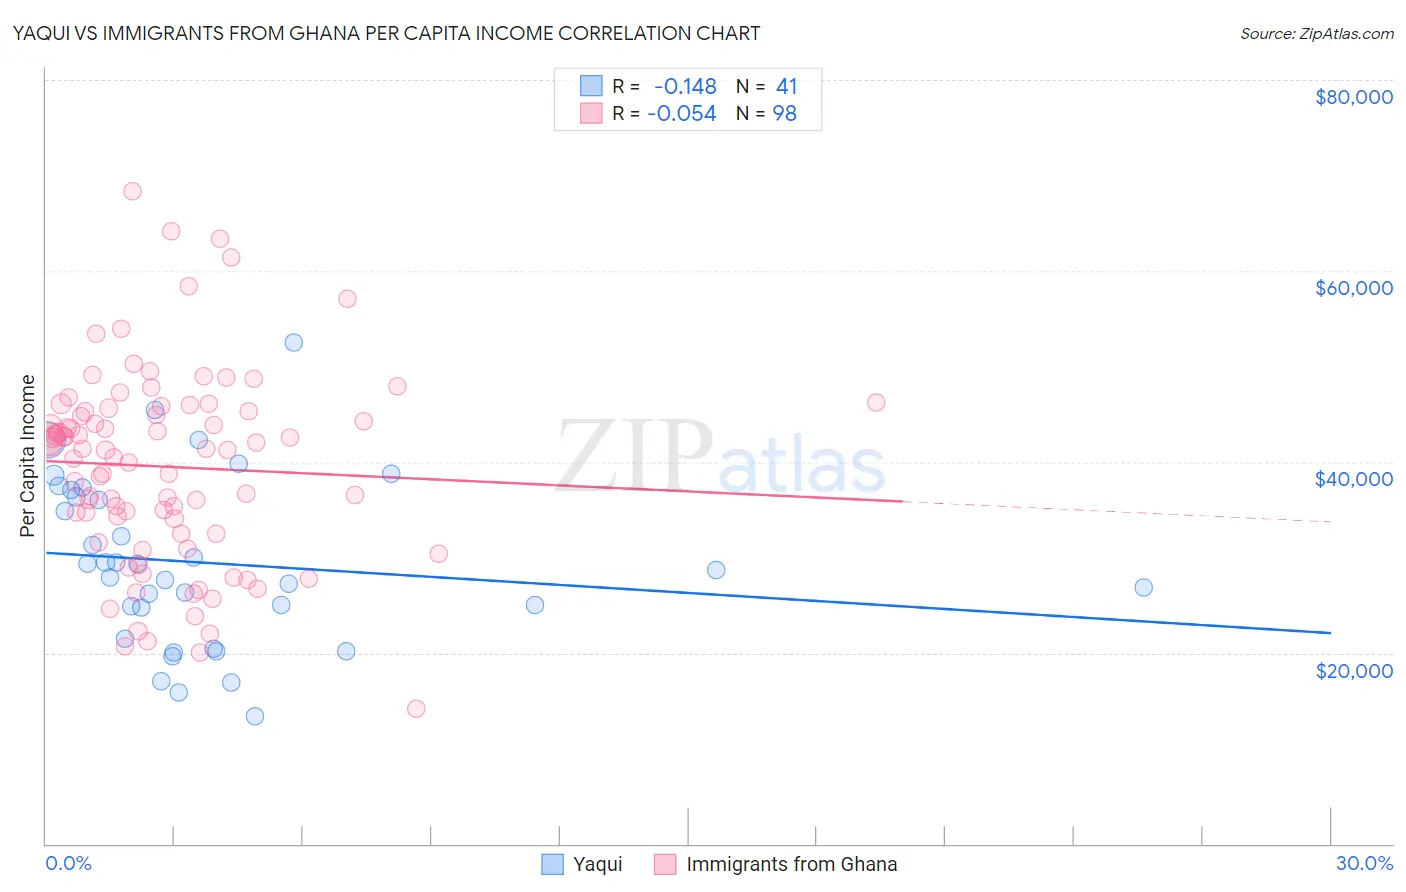
Yaqui vs Immigrants from Ghana Per Capita Income Correlation Chart
The statistical analysis conducted on geographies consisting of 107,738,640 people shows a poor negative correlation between the proportion of Yaqui and per capita income in the United States with a correlation coefficient (R) of -0.148 and weighted average of $36,112. Similarly, the statistical analysis conducted on geographies consisting of 199,964,611 people shows a slight negative correlation between the proportion of Immigrants from Ghana and per capita income in the United States with a correlation coefficient (R) of -0.054 and weighted average of $41,131, a difference of 13.9%.
Per Capita Income Correlation Summary
| Measurement | Yaqui | Immigrants from Ghana |
| Minimum | $13,349 | $14,179 |
| Maximum | $52,546 | $68,358 |
| Range | $39,197 | $54,179 |
| Mean | $29,404 | $39,490 |
| Median | $28,671 | $41,313 |
| Interquartile 25% (IQ1) | $23,138 | $32,441 |
| Interquartile 75% (IQ3) | $36,720 | $45,276 |
| Interquartile Range (IQR) | $13,582 | $12,835 |
| Standard Deviation (Sample) | $8,788 | $10,193 |
| Standard Deviation (Population) | $8,680 | $10,141 |
Similar Demographics by Per Capita Income
Demographics Similar to Yaqui by Per Capita Income
In terms of per capita income, the demographic groups most similar to Yaqui are Seminole ($36,180, a difference of 0.19%), Choctaw ($35,999, a difference of 0.31%), Dutch West Indian ($35,922, a difference of 0.53%), Bangladeshi ($35,897, a difference of 0.60%), and Bahamian ($36,427, a difference of 0.87%).
| Demographics | Rating | Rank | Per Capita Income |
| Fijians | 0.0 /100 | #308 | Tragic $36,690 |
| Immigrants | Honduras | 0.0 /100 | #309 | Tragic $36,665 |
| Ute | 0.0 /100 | #310 | Tragic $36,651 |
| Chippewa | 0.0 /100 | #311 | Tragic $36,631 |
| Chickasaw | 0.0 /100 | #312 | Tragic $36,475 |
| Bahamians | 0.0 /100 | #313 | Tragic $36,427 |
| Seminole | 0.0 /100 | #314 | Tragic $36,180 |
| Yaqui | 0.0 /100 | #315 | Tragic $36,112 |
| Choctaw | 0.0 /100 | #316 | Tragic $35,999 |
| Dutch West Indians | 0.0 /100 | #317 | Tragic $35,922 |
| Bangladeshis | 0.0 /100 | #318 | Tragic $35,897 |
| Immigrants | Congo | 0.0 /100 | #319 | Tragic $35,720 |
| Hispanics or Latinos | 0.0 /100 | #320 | Tragic $35,688 |
| Blacks/African Americans | 0.0 /100 | #321 | Tragic $35,564 |
| Creek | 0.0 /100 | #322 | Tragic $35,546 |
Demographics Similar to Immigrants from Ghana by Per Capita Income
In terms of per capita income, the demographic groups most similar to Immigrants from Ghana are Immigrants from Grenada ($41,123, a difference of 0.020%), Immigrants from Ecuador ($41,195, a difference of 0.16%), West Indian ($41,217, a difference of 0.21%), Nigerian ($41,026, a difference of 0.26%), and Native Hawaiian ($41,017, a difference of 0.28%).
| Demographics | Rating | Rank | Per Capita Income |
| Immigrants | Barbados | 7.9 /100 | #220 | Tragic $41,478 |
| Immigrants | Trinidad and Tobago | 7.9 /100 | #221 | Tragic $41,476 |
| Immigrants | Iraq | 7.1 /100 | #222 | Tragic $41,365 |
| Immigrants | Cameroon | 6.8 /100 | #223 | Tragic $41,334 |
| Immigrants | St. Vincent and the Grenadines | 6.4 /100 | #224 | Tragic $41,270 |
| West Indians | 6.0 /100 | #225 | Tragic $41,217 |
| Immigrants | Ecuador | 5.9 /100 | #226 | Tragic $41,195 |
| Immigrants | Ghana | 5.5 /100 | #227 | Tragic $41,131 |
| Immigrants | Grenada | 5.5 /100 | #228 | Tragic $41,123 |
| Nigerians | 4.9 /100 | #229 | Tragic $41,026 |
| Native Hawaiians | 4.9 /100 | #230 | Tragic $41,017 |
| Senegalese | 4.8 /100 | #231 | Tragic $41,000 |
| Guyanese | 4.5 /100 | #232 | Tragic $40,949 |
| Delaware | 3.8 /100 | #233 | Tragic $40,778 |
| Immigrants | West Indies | 3.7 /100 | #234 | Tragic $40,763 |