Polish vs Immigrants from Ghana Master's Degree
COMPARE
Polish
Immigrants from Ghana
Master's Degree
Master's Degree Comparison
Poles
Immigrants from Ghana
15.7%
MASTER'S DEGREE
85.0/ 100
METRIC RATING
141st/ 347
METRIC RANK
15.0%
MASTER'S DEGREE
53.6/ 100
METRIC RATING
171st/ 347
METRIC RANK
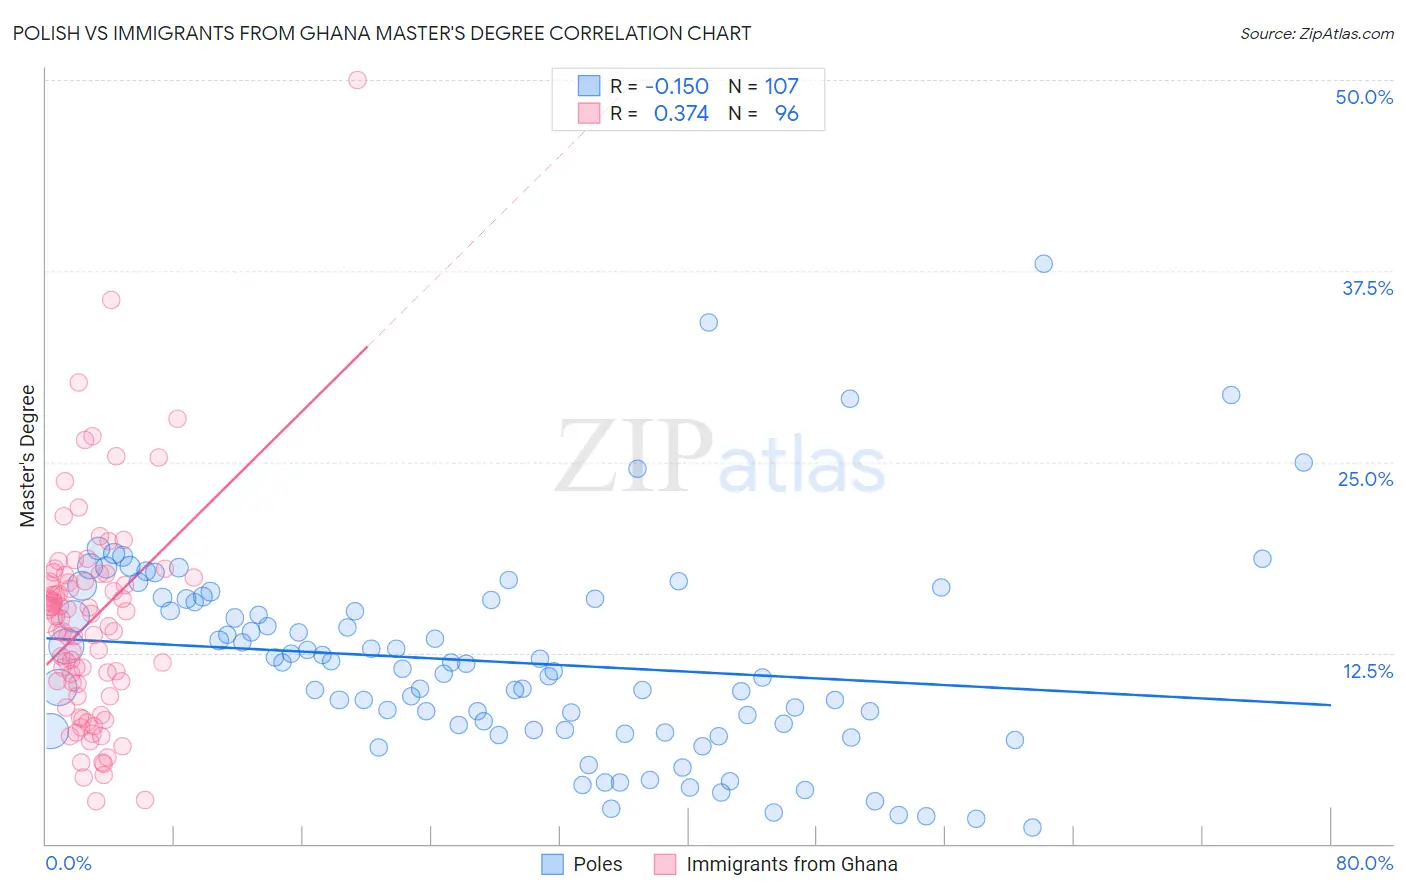
Polish vs Immigrants from Ghana Master's Degree Correlation Chart
The statistical analysis conducted on geographies consisting of 559,882,025 people shows a poor negative correlation between the proportion of Poles and percentage of population with at least master's degree education in the United States with a correlation coefficient (R) of -0.150 and weighted average of 15.7%. Similarly, the statistical analysis conducted on geographies consisting of 199,892,206 people shows a mild positive correlation between the proportion of Immigrants from Ghana and percentage of population with at least master's degree education in the United States with a correlation coefficient (R) of 0.374 and weighted average of 15.0%, a difference of 5.1%.
Master's Degree Correlation Summary
| Measurement | Polish | Immigrants from Ghana |
| Minimum | 1.0% | 2.8% |
| Maximum | 37.9% | 50.0% |
| Range | 36.9% | 47.2% |
| Mean | 11.9% | 14.5% |
| Median | 11.5% | 14.8% |
| Interquartile 25% (IQ1) | 7.4% | 10.1% |
| Interquartile 75% (IQ3) | 16.0% | 17.3% |
| Interquartile Range (IQR) | 8.5% | 7.2% |
| Standard Deviation (Sample) | 6.6% | 7.1% |
| Standard Deviation (Population) | 6.6% | 7.1% |
Similar Demographics by Master's Degree
Demographics Similar to Poles by Master's Degree
In terms of master's degree, the demographic groups most similar to Poles are Vietnamese (15.8%, a difference of 0.12%), Immigrants from Germany (15.8%, a difference of 0.21%), Immigrants from Africa (15.7%, a difference of 0.23%), Pakistani (15.8%, a difference of 0.27%), and Immigrants from Venezuela (15.7%, a difference of 0.32%).
| Demographics | Rating | Rank | Master's Degree |
| Venezuelans | 88.4 /100 | #134 | Excellent 15.9% |
| South American Indians | 88.4 /100 | #135 | Excellent 15.9% |
| Assyrians/Chaldeans/Syriacs | 86.8 /100 | #136 | Excellent 15.8% |
| Europeans | 86.4 /100 | #137 | Excellent 15.8% |
| Pakistanis | 86.1 /100 | #138 | Excellent 15.8% |
| Immigrants | Germany | 85.9 /100 | #139 | Excellent 15.8% |
| Vietnamese | 85.5 /100 | #140 | Excellent 15.8% |
| Poles | 85.0 /100 | #141 | Excellent 15.7% |
| Immigrants | Africa | 84.0 /100 | #142 | Excellent 15.7% |
| Immigrants | Venezuela | 83.6 /100 | #143 | Excellent 15.7% |
| Canadians | 83.3 /100 | #144 | Excellent 15.7% |
| South Americans | 81.3 /100 | #145 | Excellent 15.6% |
| Immigrants | Afghanistan | 79.4 /100 | #146 | Good 15.6% |
| Hungarians | 79.1 /100 | #147 | Good 15.6% |
| Immigrants | Senegal | 78.2 /100 | #148 | Good 15.5% |
Demographics Similar to Immigrants from Ghana by Master's Degree
In terms of master's degree, the demographic groups most similar to Immigrants from Ghana are Immigrants from Uruguay (15.0%, a difference of 0.10%), Costa Rican (15.0%, a difference of 0.14%), Irish (15.0%, a difference of 0.35%), Slovak (14.9%, a difference of 0.46%), and Immigrants from Peru (14.9%, a difference of 0.51%).
| Demographics | Rating | Rank | Master's Degree |
| Colombians | 66.9 /100 | #164 | Good 15.3% |
| Immigrants | Kenya | 66.6 /100 | #165 | Good 15.3% |
| Swedes | 66.1 /100 | #166 | Good 15.2% |
| Senegalese | 65.6 /100 | #167 | Good 15.2% |
| Immigrants | North Macedonia | 64.5 /100 | #168 | Good 15.2% |
| Scottish | 62.7 /100 | #169 | Good 15.2% |
| Irish | 56.3 /100 | #170 | Average 15.0% |
| Immigrants | Ghana | 53.6 /100 | #171 | Average 15.0% |
| Immigrants | Uruguay | 52.8 /100 | #172 | Average 15.0% |
| Costa Ricans | 52.5 /100 | #173 | Average 15.0% |
| Slovaks | 50.0 /100 | #174 | Average 14.9% |
| Immigrants | Peru | 49.6 /100 | #175 | Average 14.9% |
| Nigerians | 48.6 /100 | #176 | Average 14.9% |
| Immigrants | Colombia | 48.3 /100 | #177 | Average 14.9% |
| English | 45.0 /100 | #178 | Average 14.8% |