Peruvian vs Bhutanese Median Earnings
COMPARE
Peruvian
Bhutanese
Median Earnings
Median Earnings Comparison
Peruvians
Bhutanese
$47,628
MEDIAN EARNINGS
84.2/ 100
METRIC RATING
150th/ 347
METRIC RANK
$52,297
MEDIAN EARNINGS
100.0/ 100
METRIC RATING
46th/ 347
METRIC RANK
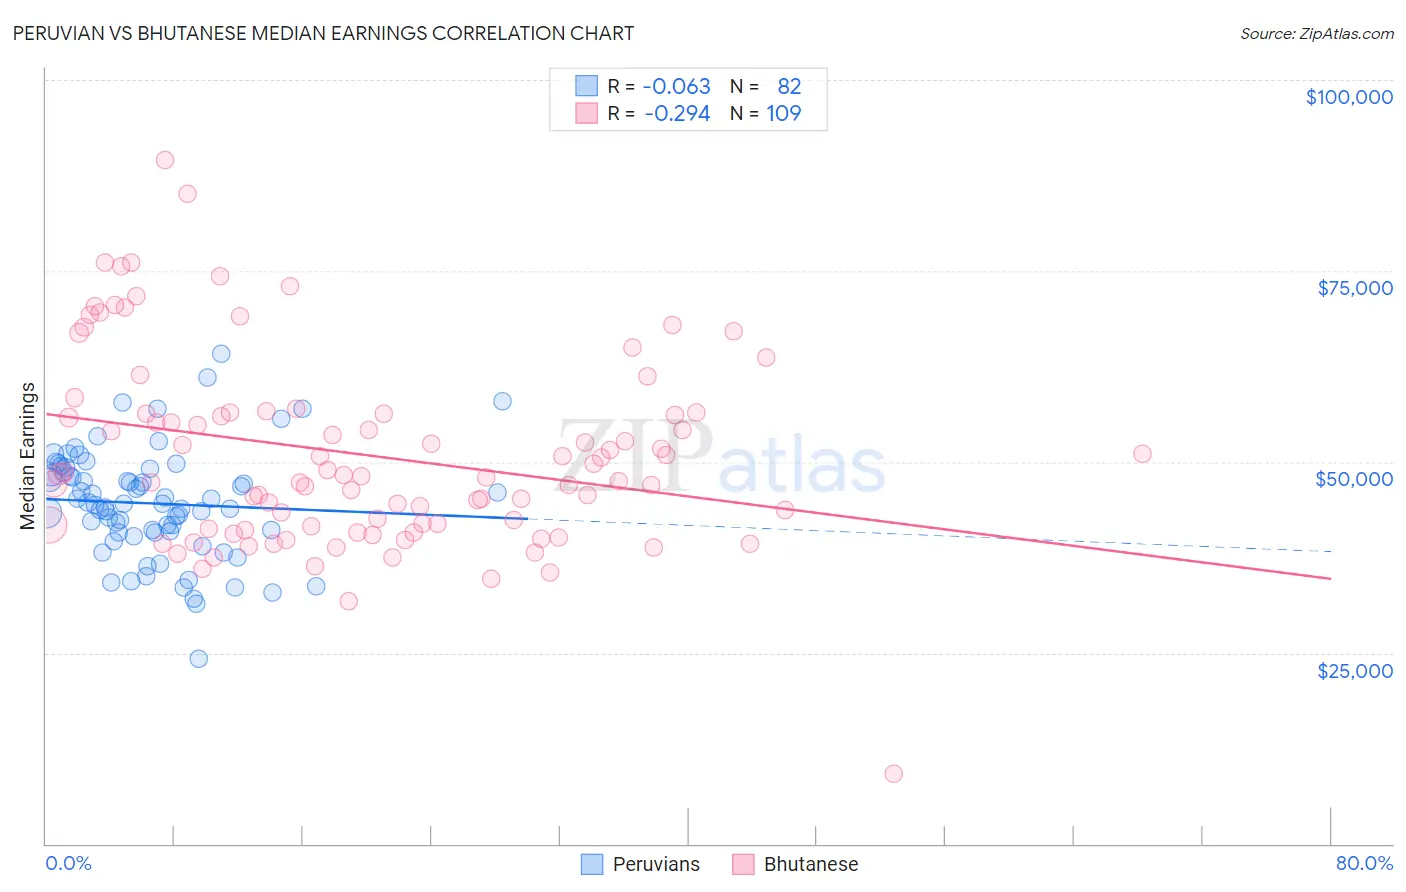
Peruvian vs Bhutanese Median Earnings Correlation Chart
The statistical analysis conducted on geographies consisting of 363,247,580 people shows a slight negative correlation between the proportion of Peruvians and median earnings in the United States with a correlation coefficient (R) of -0.063 and weighted average of $47,628. Similarly, the statistical analysis conducted on geographies consisting of 455,560,671 people shows a weak negative correlation between the proportion of Bhutanese and median earnings in the United States with a correlation coefficient (R) of -0.294 and weighted average of $52,297, a difference of 9.8%.
Median Earnings Correlation Summary
| Measurement | Peruvian | Bhutanese |
| Minimum | $24,212 | $9,211 |
| Maximum | $64,091 | $89,590 |
| Range | $39,879 | $80,379 |
| Mean | $44,547 | $50,906 |
| Median | $44,525 | $48,356 |
| Interquartile 25% (IQ1) | $40,828 | $41,435 |
| Interquartile 75% (IQ3) | $48,604 | $56,370 |
| Interquartile Range (IQR) | $7,775 | $14,935 |
| Standard Deviation (Sample) | $7,153 | $12,596 |
| Standard Deviation (Population) | $7,110 | $12,538 |
Similar Demographics by Median Earnings
Demographics Similar to Peruvians by Median Earnings
In terms of median earnings, the demographic groups most similar to Peruvians are Luxembourger ($47,640, a difference of 0.020%), Immigrants from Oceania ($47,617, a difference of 0.020%), Immigrants from Eritrea ($47,657, a difference of 0.060%), Immigrants from South Eastern Asia ($47,671, a difference of 0.090%), and Immigrants from Germany ($47,566, a difference of 0.13%).
| Demographics | Rating | Rank | Median Earnings |
| Swedes | 88.0 /100 | #143 | Excellent $47,851 |
| Hungarians | 87.1 /100 | #144 | Excellent $47,795 |
| Immigrants | Saudi Arabia | 85.6 /100 | #145 | Excellent $47,704 |
| Immigrants | Chile | 85.5 /100 | #146 | Excellent $47,697 |
| Immigrants | South Eastern Asia | 85.0 /100 | #147 | Excellent $47,671 |
| Immigrants | Eritrea | 84.8 /100 | #148 | Excellent $47,657 |
| Luxembourgers | 84.5 /100 | #149 | Excellent $47,640 |
| Peruvians | 84.2 /100 | #150 | Excellent $47,628 |
| Immigrants | Oceania | 84.1 /100 | #151 | Excellent $47,617 |
| Immigrants | Germany | 83.1 /100 | #152 | Excellent $47,566 |
| Slavs | 81.1 /100 | #153 | Excellent $47,470 |
| Immigrants | Portugal | 77.3 /100 | #154 | Good $47,304 |
| Immigrants | Vietnam | 76.7 /100 | #155 | Good $47,282 |
| Irish | 76.6 /100 | #156 | Good $47,276 |
| Czechs | 75.1 /100 | #157 | Good $47,221 |
Demographics Similar to Bhutanese by Median Earnings
In terms of median earnings, the demographic groups most similar to Bhutanese are Australian ($52,294, a difference of 0.010%), Immigrants from Czechoslovakia ($52,361, a difference of 0.12%), Immigrants from Europe ($52,195, a difference of 0.20%), Immigrants from Malaysia ($52,514, a difference of 0.41%), and Bulgarian ($52,512, a difference of 0.41%).
| Demographics | Rating | Rank | Median Earnings |
| Immigrants | Turkey | 100.0 /100 | #39 | Exceptional $52,960 |
| Israelis | 100.0 /100 | #40 | Exceptional $52,937 |
| Immigrants | Lithuania | 100.0 /100 | #41 | Exceptional $52,769 |
| Maltese | 100.0 /100 | #42 | Exceptional $52,526 |
| Immigrants | Malaysia | 100.0 /100 | #43 | Exceptional $52,514 |
| Bulgarians | 100.0 /100 | #44 | Exceptional $52,512 |
| Immigrants | Czechoslovakia | 100.0 /100 | #45 | Exceptional $52,361 |
| Bhutanese | 100.0 /100 | #46 | Exceptional $52,297 |
| Australians | 100.0 /100 | #47 | Exceptional $52,294 |
| Immigrants | Europe | 100.0 /100 | #48 | Exceptional $52,195 |
| Bolivians | 100.0 /100 | #49 | Exceptional $52,005 |
| Immigrants | South Africa | 100.0 /100 | #50 | Exceptional $51,850 |
| Immigrants | Austria | 99.9 /100 | #51 | Exceptional $51,826 |
| Estonians | 99.9 /100 | #52 | Exceptional $51,772 |
| Immigrants | Norway | 99.9 /100 | #53 | Exceptional $51,758 |