Peruvian vs Immigrants from Pakistan Median Earnings
COMPARE
Peruvian
Immigrants from Pakistan
Median Earnings
Median Earnings Comparison
Peruvians
Immigrants from Pakistan
$47,628
MEDIAN EARNINGS
84.2/ 100
METRIC RATING
150th/ 347
METRIC RANK
$51,693
MEDIAN EARNINGS
99.9/ 100
METRIC RATING
56th/ 347
METRIC RANK
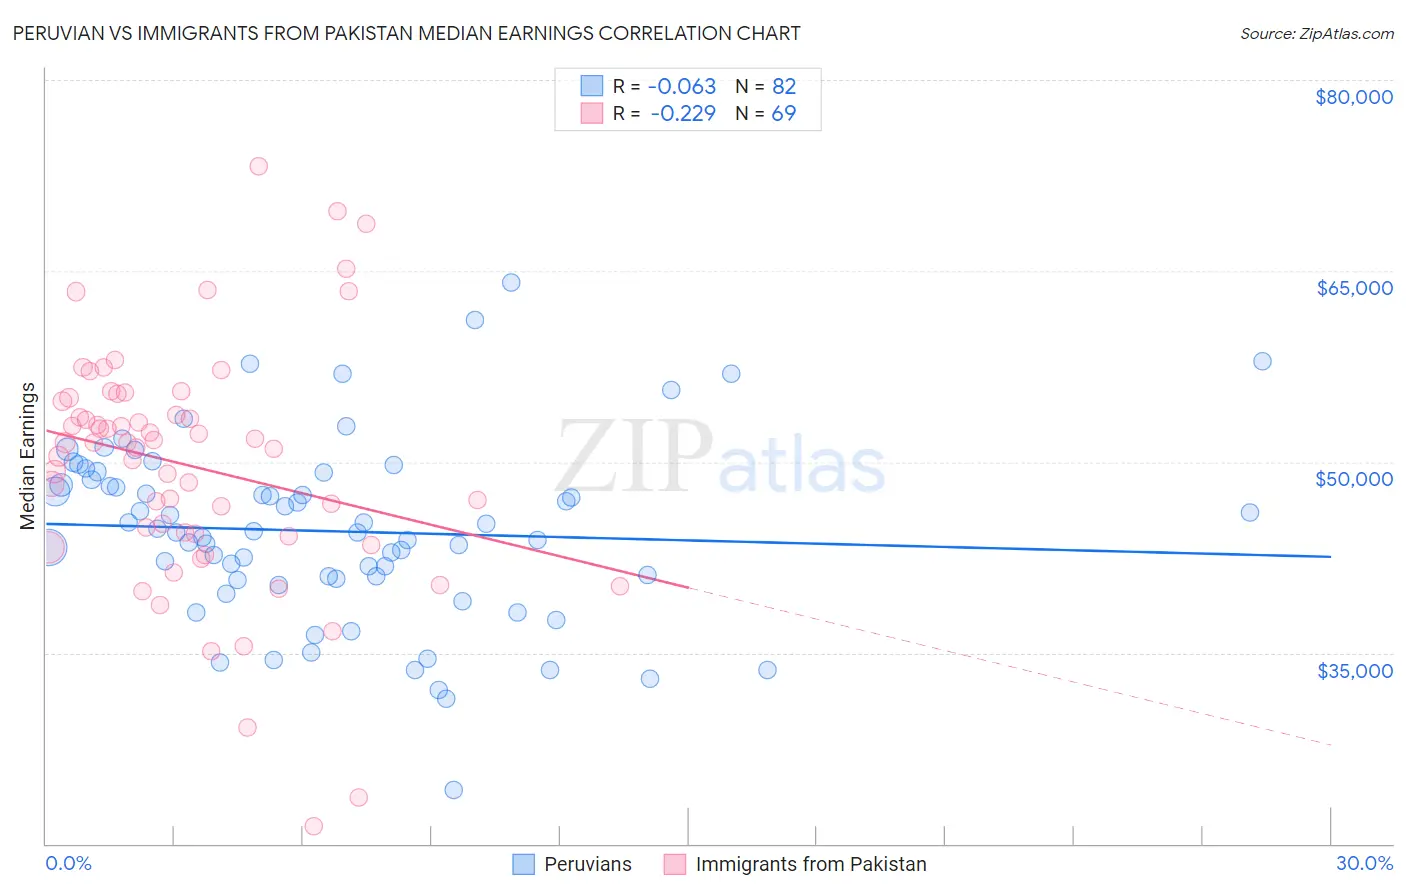
Peruvian vs Immigrants from Pakistan Median Earnings Correlation Chart
The statistical analysis conducted on geographies consisting of 363,247,580 people shows a slight negative correlation between the proportion of Peruvians and median earnings in the United States with a correlation coefficient (R) of -0.063 and weighted average of $47,628. Similarly, the statistical analysis conducted on geographies consisting of 283,895,517 people shows a weak negative correlation between the proportion of Immigrants from Pakistan and median earnings in the United States with a correlation coefficient (R) of -0.229 and weighted average of $51,693, a difference of 8.5%.
Median Earnings Correlation Summary
| Measurement | Peruvian | Immigrants from Pakistan |
| Minimum | $24,212 | $21,371 |
| Maximum | $64,091 | $73,220 |
| Range | $39,879 | $51,849 |
| Mean | $44,547 | $49,677 |
| Median | $44,525 | $51,477 |
| Interquartile 25% (IQ1) | $40,828 | $44,262 |
| Interquartile 75% (IQ3) | $48,604 | $54,915 |
| Interquartile Range (IQR) | $7,775 | $10,654 |
| Standard Deviation (Sample) | $7,153 | $9,518 |
| Standard Deviation (Population) | $7,110 | $9,449 |
Similar Demographics by Median Earnings
Demographics Similar to Peruvians by Median Earnings
In terms of median earnings, the demographic groups most similar to Peruvians are Luxembourger ($47,640, a difference of 0.020%), Immigrants from Oceania ($47,617, a difference of 0.020%), Immigrants from Eritrea ($47,657, a difference of 0.060%), Immigrants from South Eastern Asia ($47,671, a difference of 0.090%), and Immigrants from Germany ($47,566, a difference of 0.13%).
| Demographics | Rating | Rank | Median Earnings |
| Swedes | 88.0 /100 | #143 | Excellent $47,851 |
| Hungarians | 87.1 /100 | #144 | Excellent $47,795 |
| Immigrants | Saudi Arabia | 85.6 /100 | #145 | Excellent $47,704 |
| Immigrants | Chile | 85.5 /100 | #146 | Excellent $47,697 |
| Immigrants | South Eastern Asia | 85.0 /100 | #147 | Excellent $47,671 |
| Immigrants | Eritrea | 84.8 /100 | #148 | Excellent $47,657 |
| Luxembourgers | 84.5 /100 | #149 | Excellent $47,640 |
| Peruvians | 84.2 /100 | #150 | Excellent $47,628 |
| Immigrants | Oceania | 84.1 /100 | #151 | Excellent $47,617 |
| Immigrants | Germany | 83.1 /100 | #152 | Excellent $47,566 |
| Slavs | 81.1 /100 | #153 | Excellent $47,470 |
| Immigrants | Portugal | 77.3 /100 | #154 | Good $47,304 |
| Immigrants | Vietnam | 76.7 /100 | #155 | Good $47,282 |
| Irish | 76.6 /100 | #156 | Good $47,276 |
| Czechs | 75.1 /100 | #157 | Good $47,221 |
Demographics Similar to Immigrants from Pakistan by Median Earnings
In terms of median earnings, the demographic groups most similar to Immigrants from Pakistan are Egyptian ($51,701, a difference of 0.010%), Immigrants from Indonesia ($51,715, a difference of 0.040%), Immigrants from Norway ($51,758, a difference of 0.13%), Immigrants from Eastern Europe ($51,624, a difference of 0.13%), and Estonian ($51,772, a difference of 0.15%).
| Demographics | Rating | Rank | Median Earnings |
| Bolivians | 100.0 /100 | #49 | Exceptional $52,005 |
| Immigrants | South Africa | 100.0 /100 | #50 | Exceptional $51,850 |
| Immigrants | Austria | 99.9 /100 | #51 | Exceptional $51,826 |
| Estonians | 99.9 /100 | #52 | Exceptional $51,772 |
| Immigrants | Norway | 99.9 /100 | #53 | Exceptional $51,758 |
| Immigrants | Indonesia | 99.9 /100 | #54 | Exceptional $51,715 |
| Egyptians | 99.9 /100 | #55 | Exceptional $51,701 |
| Immigrants | Pakistan | 99.9 /100 | #56 | Exceptional $51,693 |
| Immigrants | Eastern Europe | 99.9 /100 | #57 | Exceptional $51,624 |
| Immigrants | Bolivia | 99.9 /100 | #58 | Exceptional $51,605 |
| Immigrants | Croatia | 99.9 /100 | #59 | Exceptional $51,581 |
| Immigrants | Serbia | 99.9 /100 | #60 | Exceptional $51,557 |
| Immigrants | Latvia | 99.9 /100 | #61 | Exceptional $51,555 |
| Immigrants | Romania | 99.9 /100 | #62 | Exceptional $51,337 |
| Immigrants | Bulgaria | 99.9 /100 | #63 | Exceptional $51,318 |