Peruvian vs Immigrants from Japan Median Earnings
COMPARE
Peruvian
Immigrants from Japan
Median Earnings
Median Earnings Comparison
Peruvians
Immigrants from Japan
$47,628
MEDIAN EARNINGS
84.2/ 100
METRIC RATING
150th/ 347
METRIC RANK
$54,938
MEDIAN EARNINGS
100.0/ 100
METRIC RATING
18th/ 347
METRIC RANK
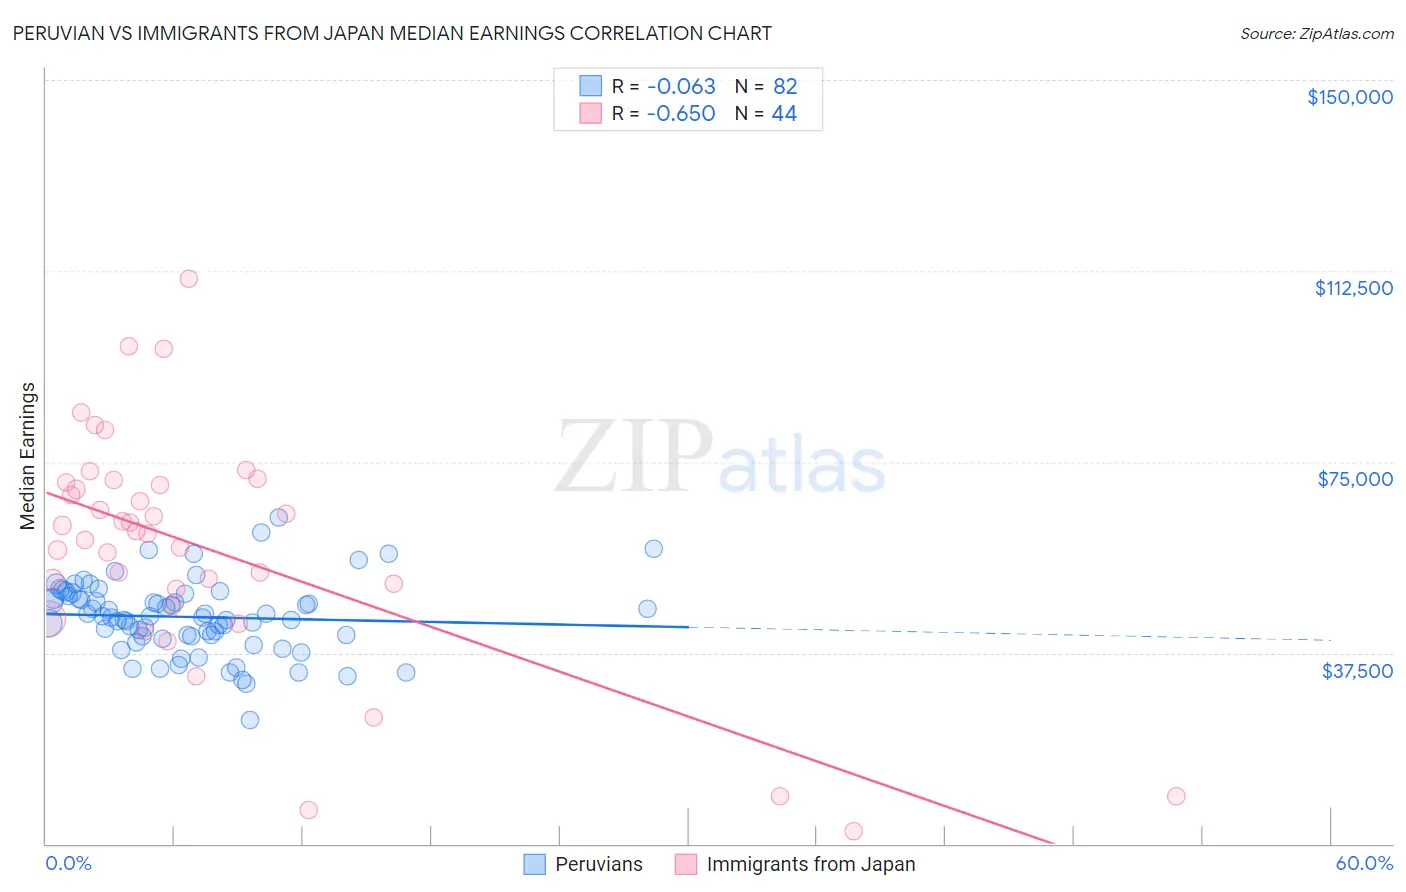
Peruvian vs Immigrants from Japan Median Earnings Correlation Chart
The statistical analysis conducted on geographies consisting of 363,247,580 people shows a slight negative correlation between the proportion of Peruvians and median earnings in the United States with a correlation coefficient (R) of -0.063 and weighted average of $47,628. Similarly, the statistical analysis conducted on geographies consisting of 340,132,421 people shows a significant negative correlation between the proportion of Immigrants from Japan and median earnings in the United States with a correlation coefficient (R) of -0.650 and weighted average of $54,938, a difference of 15.3%.
Median Earnings Correlation Summary
| Measurement | Peruvian | Immigrants from Japan |
| Minimum | $24,212 | $2,499 |
| Maximum | $64,091 | $110,893 |
| Range | $39,879 | $108,394 |
| Mean | $44,547 | $57,767 |
| Median | $44,525 | $61,115 |
| Interquartile 25% (IQ1) | $40,828 | $48,389 |
| Interquartile 75% (IQ3) | $48,604 | $70,647 |
| Interquartile Range (IQR) | $7,775 | $22,258 |
| Standard Deviation (Sample) | $7,153 | $23,135 |
| Standard Deviation (Population) | $7,110 | $22,870 |
Similar Demographics by Median Earnings
Demographics Similar to Peruvians by Median Earnings
In terms of median earnings, the demographic groups most similar to Peruvians are Luxembourger ($47,640, a difference of 0.020%), Immigrants from Oceania ($47,617, a difference of 0.020%), Immigrants from Eritrea ($47,657, a difference of 0.060%), Immigrants from South Eastern Asia ($47,671, a difference of 0.090%), and Immigrants from Germany ($47,566, a difference of 0.13%).
| Demographics | Rating | Rank | Median Earnings |
| Swedes | 88.0 /100 | #143 | Excellent $47,851 |
| Hungarians | 87.1 /100 | #144 | Excellent $47,795 |
| Immigrants | Saudi Arabia | 85.6 /100 | #145 | Excellent $47,704 |
| Immigrants | Chile | 85.5 /100 | #146 | Excellent $47,697 |
| Immigrants | South Eastern Asia | 85.0 /100 | #147 | Excellent $47,671 |
| Immigrants | Eritrea | 84.8 /100 | #148 | Excellent $47,657 |
| Luxembourgers | 84.5 /100 | #149 | Excellent $47,640 |
| Peruvians | 84.2 /100 | #150 | Excellent $47,628 |
| Immigrants | Oceania | 84.1 /100 | #151 | Excellent $47,617 |
| Immigrants | Germany | 83.1 /100 | #152 | Excellent $47,566 |
| Slavs | 81.1 /100 | #153 | Excellent $47,470 |
| Immigrants | Portugal | 77.3 /100 | #154 | Good $47,304 |
| Immigrants | Vietnam | 76.7 /100 | #155 | Good $47,282 |
| Irish | 76.6 /100 | #156 | Good $47,276 |
| Czechs | 75.1 /100 | #157 | Good $47,221 |
Demographics Similar to Immigrants from Japan by Median Earnings
In terms of median earnings, the demographic groups most similar to Immigrants from Japan are Eastern European ($55,084, a difference of 0.26%), Immigrants from Belgium ($54,679, a difference of 0.47%), Cypriot ($54,589, a difference of 0.64%), Burmese ($54,559, a difference of 0.69%), and Immigrants from Korea ($54,530, a difference of 0.75%).
| Demographics | Rating | Rank | Median Earnings |
| Immigrants | Israel | 100.0 /100 | #11 | Exceptional $57,034 |
| Immigrants | Ireland | 100.0 /100 | #12 | Exceptional $56,854 |
| Immigrants | China | 100.0 /100 | #13 | Exceptional $56,638 |
| Immigrants | Australia | 100.0 /100 | #14 | Exceptional $56,305 |
| Indians (Asian) | 100.0 /100 | #15 | Exceptional $56,253 |
| Immigrants | Eastern Asia | 100.0 /100 | #16 | Exceptional $56,183 |
| Eastern Europeans | 100.0 /100 | #17 | Exceptional $55,084 |
| Immigrants | Japan | 100.0 /100 | #18 | Exceptional $54,938 |
| Immigrants | Belgium | 100.0 /100 | #19 | Exceptional $54,679 |
| Cypriots | 100.0 /100 | #20 | Exceptional $54,589 |
| Burmese | 100.0 /100 | #21 | Exceptional $54,559 |
| Immigrants | Korea | 100.0 /100 | #22 | Exceptional $54,530 |
| Immigrants | Sweden | 100.0 /100 | #23 | Exceptional $54,478 |
| Soviet Union | 100.0 /100 | #24 | Exceptional $54,290 |
| Turks | 100.0 /100 | #25 | Exceptional $53,919 |