Immigrants from Thailand vs Immigrants from Pakistan Median Earnings
COMPARE
Immigrants from Thailand
Immigrants from Pakistan
Median Earnings
Median Earnings Comparison
Immigrants from Thailand
Immigrants from Pakistan
$45,598
MEDIAN EARNINGS
23.7/ 100
METRIC RATING
209th/ 347
METRIC RANK
$51,693
MEDIAN EARNINGS
99.9/ 100
METRIC RATING
56th/ 347
METRIC RANK
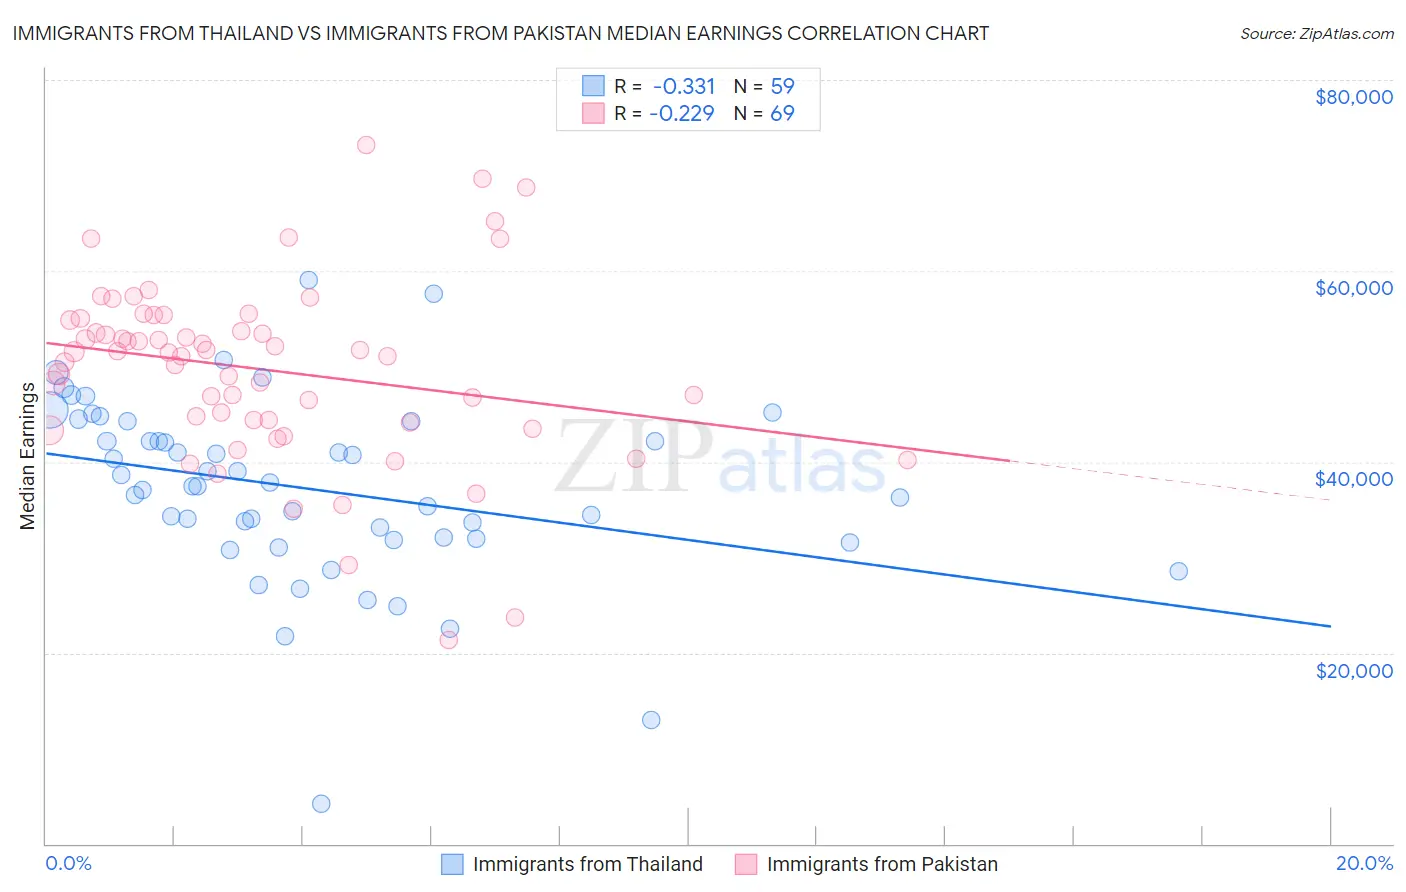
Immigrants from Thailand vs Immigrants from Pakistan Median Earnings Correlation Chart
The statistical analysis conducted on geographies consisting of 316,998,923 people shows a mild negative correlation between the proportion of Immigrants from Thailand and median earnings in the United States with a correlation coefficient (R) of -0.331 and weighted average of $45,598. Similarly, the statistical analysis conducted on geographies consisting of 283,895,517 people shows a weak negative correlation between the proportion of Immigrants from Pakistan and median earnings in the United States with a correlation coefficient (R) of -0.229 and weighted average of $51,693, a difference of 13.4%.
Median Earnings Correlation Summary
| Measurement | Immigrants from Thailand | Immigrants from Pakistan |
| Minimum | $4,250 | $21,371 |
| Maximum | $59,094 | $73,220 |
| Range | $54,844 | $51,849 |
| Mean | $37,184 | $49,677 |
| Median | $37,501 | $51,477 |
| Interquartile 25% (IQ1) | $31,980 | $44,262 |
| Interquartile 75% (IQ3) | $44,250 | $54,915 |
| Interquartile Range (IQR) | $12,270 | $10,654 |
| Standard Deviation (Sample) | $9,579 | $9,518 |
| Standard Deviation (Population) | $9,498 | $9,449 |
Similar Demographics by Median Earnings
Demographics Similar to Immigrants from Thailand by Median Earnings
In terms of median earnings, the demographic groups most similar to Immigrants from Thailand are Immigrants from Bosnia and Herzegovina ($45,600, a difference of 0.0%), Immigrants from Grenada ($45,596, a difference of 0.0%), Panamanian ($45,593, a difference of 0.010%), Bermudan ($45,593, a difference of 0.010%), and Immigrants from Senegal ($45,611, a difference of 0.030%).
| Demographics | Rating | Rank | Median Earnings |
| Immigrants | Trinidad and Tobago | 27.1 /100 | #202 | Fair $45,729 |
| Welsh | 26.6 /100 | #203 | Fair $45,710 |
| Immigrants | Uruguay | 25.9 /100 | #204 | Fair $45,682 |
| Tongans | 25.4 /100 | #205 | Fair $45,665 |
| Immigrants | Ghana | 24.8 /100 | #206 | Fair $45,641 |
| Immigrants | Senegal | 24.0 /100 | #207 | Fair $45,611 |
| Immigrants | Bosnia and Herzegovina | 23.7 /100 | #208 | Fair $45,600 |
| Immigrants | Thailand | 23.7 /100 | #209 | Fair $45,598 |
| Immigrants | Grenada | 23.6 /100 | #210 | Fair $45,596 |
| Panamanians | 23.5 /100 | #211 | Fair $45,593 |
| Bermudans | 23.5 /100 | #212 | Fair $45,593 |
| Immigrants | Colombia | 22.4 /100 | #213 | Fair $45,550 |
| Nigerians | 22.0 /100 | #214 | Fair $45,532 |
| Immigrants | Bangladesh | 22.0 /100 | #215 | Fair $45,532 |
| Guyanese | 20.6 /100 | #216 | Fair $45,470 |
Demographics Similar to Immigrants from Pakistan by Median Earnings
In terms of median earnings, the demographic groups most similar to Immigrants from Pakistan are Egyptian ($51,701, a difference of 0.010%), Immigrants from Indonesia ($51,715, a difference of 0.040%), Immigrants from Norway ($51,758, a difference of 0.13%), Immigrants from Eastern Europe ($51,624, a difference of 0.13%), and Estonian ($51,772, a difference of 0.15%).
| Demographics | Rating | Rank | Median Earnings |
| Bolivians | 100.0 /100 | #49 | Exceptional $52,005 |
| Immigrants | South Africa | 100.0 /100 | #50 | Exceptional $51,850 |
| Immigrants | Austria | 99.9 /100 | #51 | Exceptional $51,826 |
| Estonians | 99.9 /100 | #52 | Exceptional $51,772 |
| Immigrants | Norway | 99.9 /100 | #53 | Exceptional $51,758 |
| Immigrants | Indonesia | 99.9 /100 | #54 | Exceptional $51,715 |
| Egyptians | 99.9 /100 | #55 | Exceptional $51,701 |
| Immigrants | Pakistan | 99.9 /100 | #56 | Exceptional $51,693 |
| Immigrants | Eastern Europe | 99.9 /100 | #57 | Exceptional $51,624 |
| Immigrants | Bolivia | 99.9 /100 | #58 | Exceptional $51,605 |
| Immigrants | Croatia | 99.9 /100 | #59 | Exceptional $51,581 |
| Immigrants | Serbia | 99.9 /100 | #60 | Exceptional $51,557 |
| Immigrants | Latvia | 99.9 /100 | #61 | Exceptional $51,555 |
| Immigrants | Romania | 99.9 /100 | #62 | Exceptional $51,337 |
| Immigrants | Bulgaria | 99.9 /100 | #63 | Exceptional $51,318 |