Lumbee vs Immigrants from Pakistan Median Earnings
COMPARE
Lumbee
Immigrants from Pakistan
Median Earnings
Median Earnings Comparison
Lumbee
Immigrants from Pakistan
$36,876
MEDIAN EARNINGS
0.0/ 100
METRIC RATING
341st/ 347
METRIC RANK
$51,693
MEDIAN EARNINGS
99.9/ 100
METRIC RATING
56th/ 347
METRIC RANK
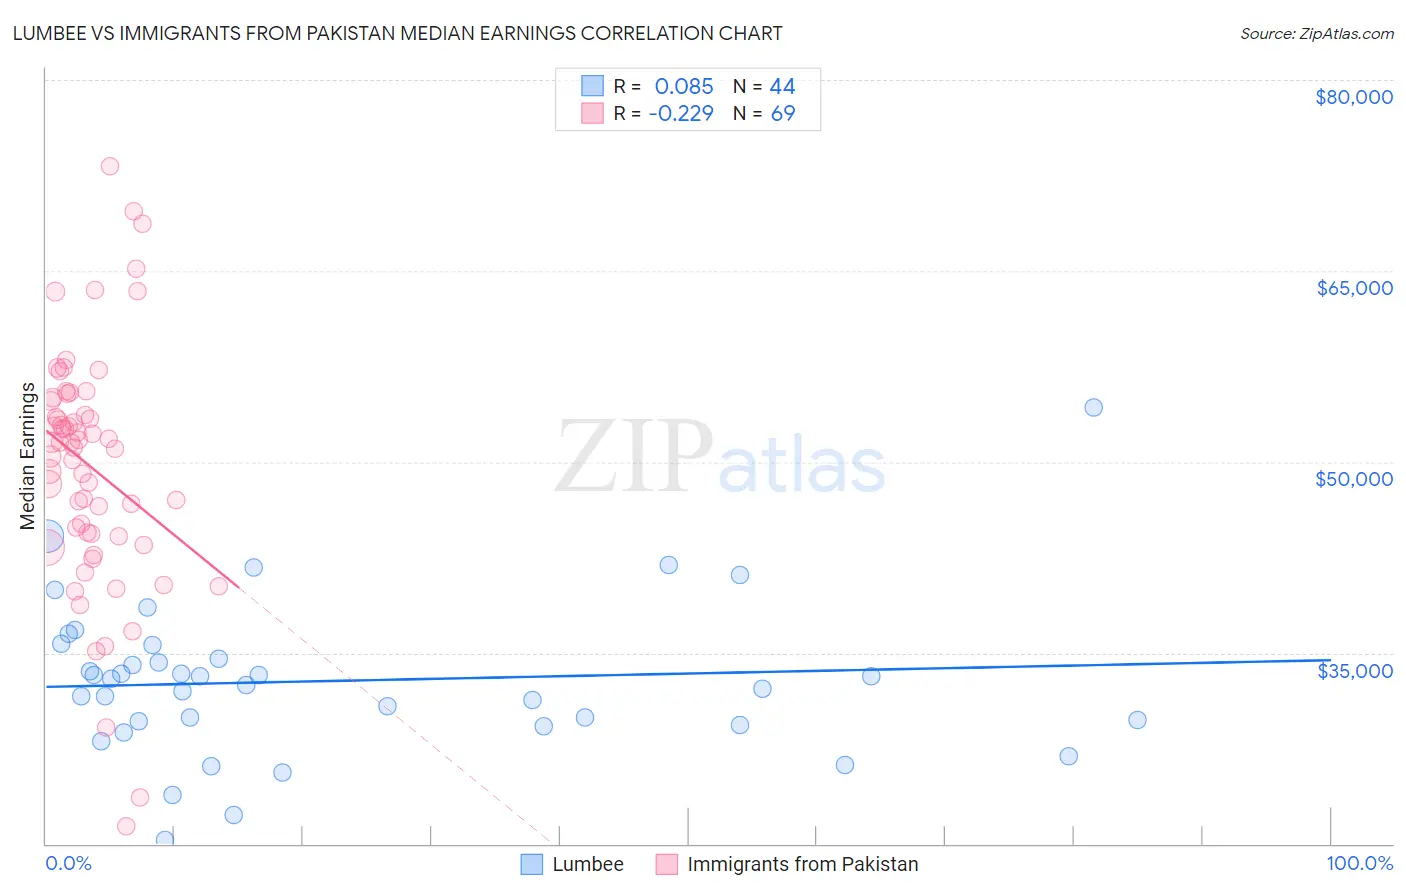
Lumbee vs Immigrants from Pakistan Median Earnings Correlation Chart
The statistical analysis conducted on geographies consisting of 92,282,036 people shows a slight positive correlation between the proportion of Lumbee and median earnings in the United States with a correlation coefficient (R) of 0.085 and weighted average of $36,876. Similarly, the statistical analysis conducted on geographies consisting of 283,895,517 people shows a weak negative correlation between the proportion of Immigrants from Pakistan and median earnings in the United States with a correlation coefficient (R) of -0.229 and weighted average of $51,693, a difference of 40.2%.
Median Earnings Correlation Summary
| Measurement | Lumbee | Immigrants from Pakistan |
| Minimum | $20,337 | $21,371 |
| Maximum | $54,265 | $73,220 |
| Range | $33,928 | $51,849 |
| Mean | $32,791 | $49,677 |
| Median | $32,724 | $51,477 |
| Interquartile 25% (IQ1) | $29,449 | $44,262 |
| Interquartile 75% (IQ3) | $35,034 | $54,915 |
| Interquartile Range (IQR) | $5,585 | $10,654 |
| Standard Deviation (Sample) | $6,085 | $9,518 |
| Standard Deviation (Population) | $6,015 | $9,449 |
Similar Demographics by Median Earnings
Demographics Similar to Lumbee by Median Earnings
In terms of median earnings, the demographic groups most similar to Lumbee are Hopi ($36,871, a difference of 0.010%), Pueblo ($36,859, a difference of 0.050%), Navajo ($36,999, a difference of 0.33%), Arapaho ($36,586, a difference of 0.79%), and Tohono O'odham ($36,349, a difference of 1.5%).
| Demographics | Rating | Rank | Median Earnings |
| Houma | 0.0 /100 | #333 | Tragic $38,949 |
| Spanish American Indians | 0.0 /100 | #334 | Tragic $38,907 |
| Natives/Alaskans | 0.0 /100 | #335 | Tragic $38,896 |
| Crow | 0.0 /100 | #336 | Tragic $38,707 |
| Immigrants | Cuba | 0.0 /100 | #337 | Tragic $38,426 |
| Pima | 0.0 /100 | #338 | Tragic $38,285 |
| Menominee | 0.0 /100 | #339 | Tragic $37,884 |
| Navajo | 0.0 /100 | #340 | Tragic $36,999 |
| Lumbee | 0.0 /100 | #341 | Tragic $36,876 |
| Hopi | 0.0 /100 | #342 | Tragic $36,871 |
| Pueblo | 0.0 /100 | #343 | Tragic $36,859 |
| Arapaho | 0.0 /100 | #344 | Tragic $36,586 |
| Tohono O'odham | 0.0 /100 | #345 | Tragic $36,349 |
| Yup'ik | 0.0 /100 | #346 | Tragic $35,942 |
| Puerto Ricans | 0.0 /100 | #347 | Tragic $35,560 |
Demographics Similar to Immigrants from Pakistan by Median Earnings
In terms of median earnings, the demographic groups most similar to Immigrants from Pakistan are Egyptian ($51,701, a difference of 0.010%), Immigrants from Indonesia ($51,715, a difference of 0.040%), Immigrants from Norway ($51,758, a difference of 0.13%), Immigrants from Eastern Europe ($51,624, a difference of 0.13%), and Estonian ($51,772, a difference of 0.15%).
| Demographics | Rating | Rank | Median Earnings |
| Bolivians | 100.0 /100 | #49 | Exceptional $52,005 |
| Immigrants | South Africa | 100.0 /100 | #50 | Exceptional $51,850 |
| Immigrants | Austria | 99.9 /100 | #51 | Exceptional $51,826 |
| Estonians | 99.9 /100 | #52 | Exceptional $51,772 |
| Immigrants | Norway | 99.9 /100 | #53 | Exceptional $51,758 |
| Immigrants | Indonesia | 99.9 /100 | #54 | Exceptional $51,715 |
| Egyptians | 99.9 /100 | #55 | Exceptional $51,701 |
| Immigrants | Pakistan | 99.9 /100 | #56 | Exceptional $51,693 |
| Immigrants | Eastern Europe | 99.9 /100 | #57 | Exceptional $51,624 |
| Immigrants | Bolivia | 99.9 /100 | #58 | Exceptional $51,605 |
| Immigrants | Croatia | 99.9 /100 | #59 | Exceptional $51,581 |
| Immigrants | Serbia | 99.9 /100 | #60 | Exceptional $51,557 |
| Immigrants | Latvia | 99.9 /100 | #61 | Exceptional $51,555 |
| Immigrants | Romania | 99.9 /100 | #62 | Exceptional $51,337 |
| Immigrants | Bulgaria | 99.9 /100 | #63 | Exceptional $51,318 |