Egyptian vs Immigrants from Ukraine Median Male Earnings
COMPARE
Egyptian
Immigrants from Ukraine
Median Male Earnings
Median Male Earnings Comparison
Egyptians
Immigrants from Ukraine
$61,095
MEDIAN MALE EARNINGS
99.8/ 100
METRIC RATING
60th/ 347
METRIC RANK
$59,820
MEDIAN MALE EARNINGS
99.5/ 100
METRIC RATING
79th/ 347
METRIC RANK
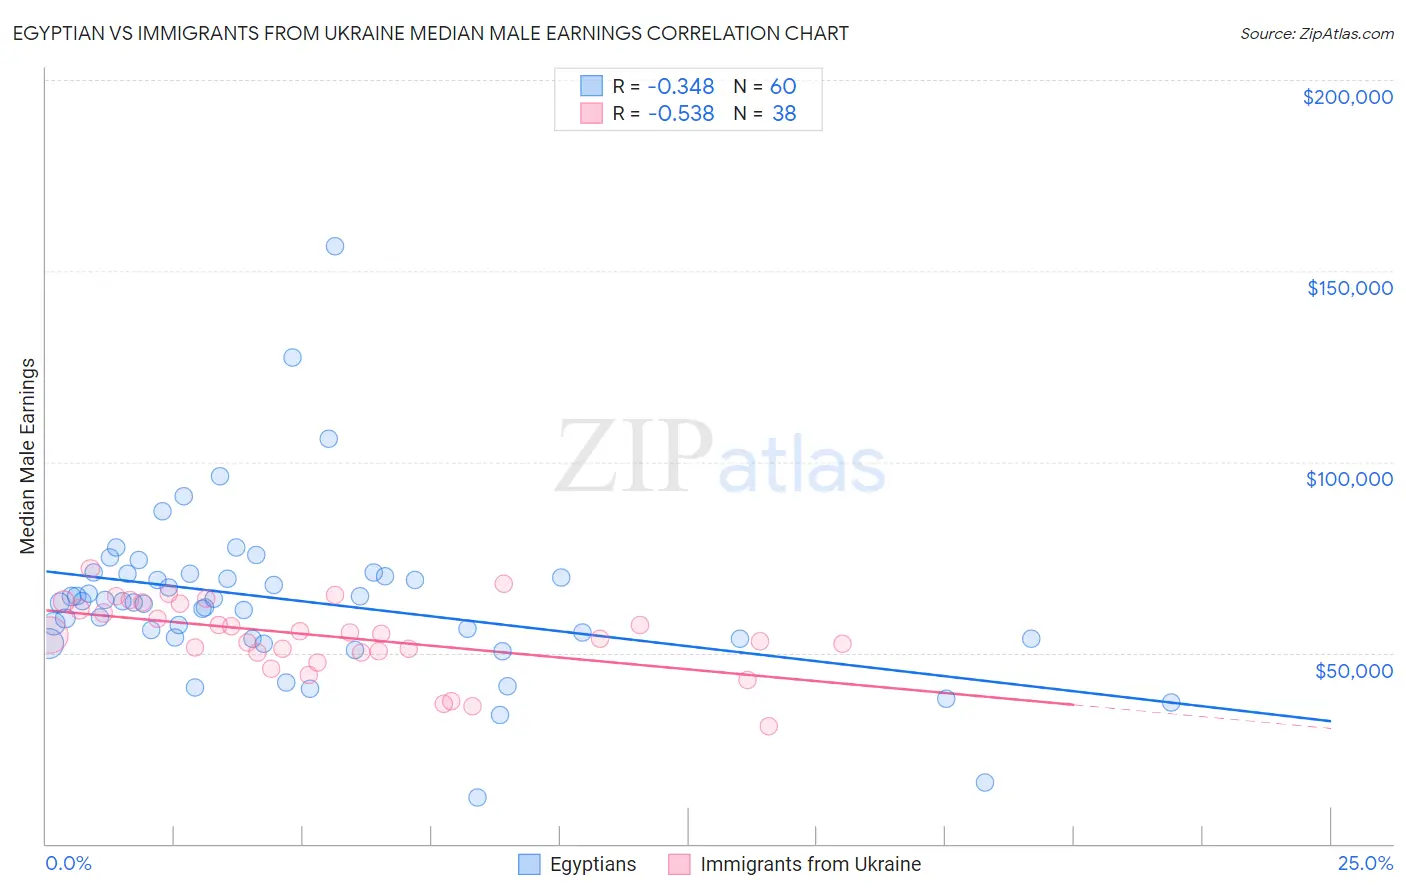
Egyptian vs Immigrants from Ukraine Median Male Earnings Correlation Chart
The statistical analysis conducted on geographies consisting of 276,910,194 people shows a mild negative correlation between the proportion of Egyptians and median male earnings in the United States with a correlation coefficient (R) of -0.348 and weighted average of $61,095. Similarly, the statistical analysis conducted on geographies consisting of 289,634,728 people shows a substantial negative correlation between the proportion of Immigrants from Ukraine and median male earnings in the United States with a correlation coefficient (R) of -0.538 and weighted average of $59,820, a difference of 2.1%.
Median Male Earnings Correlation Summary
| Measurement | Egyptian | Immigrants from Ukraine |
| Minimum | $12,000 | $30,721 |
| Maximum | $156,307 | $71,961 |
| Range | $144,307 | $41,240 |
| Mean | $63,667 | $54,290 |
| Median | $63,244 | $54,853 |
| Interquartile 25% (IQ1) | $53,758 | $49,956 |
| Interquartile 75% (IQ3) | $70,255 | $62,824 |
| Interquartile Range (IQR) | $16,497 | $12,868 |
| Standard Deviation (Sample) | $21,981 | $9,509 |
| Standard Deviation (Population) | $21,797 | $9,383 |
Demographics Similar to Egyptians and Immigrants from Ukraine by Median Male Earnings
In terms of median male earnings, the demographic groups most similar to Egyptians are Immigrants from Netherlands ($61,096, a difference of 0.0%), Bolivian ($61,066, a difference of 0.050%), Immigrants from Romania ($61,040, a difference of 0.090%), Immigrants from Pakistan ($60,987, a difference of 0.18%), and Immigrants from Eastern Europe ($60,958, a difference of 0.22%). Similarly, the demographic groups most similar to Immigrants from Ukraine are Immigrants from Egypt ($59,925, a difference of 0.18%), Paraguayan ($59,975, a difference of 0.26%), Romanian ($60,063, a difference of 0.41%), Immigrants from Bolivia ($60,088, a difference of 0.45%), and Argentinean ($60,117, a difference of 0.50%).
| Demographics | Rating | Rank | Median Male Earnings |
| Immigrants | Netherlands | 99.8 /100 | #59 | Exceptional $61,096 |
| Egyptians | 99.8 /100 | #60 | Exceptional $61,095 |
| Bolivians | 99.8 /100 | #61 | Exceptional $61,066 |
| Immigrants | Romania | 99.8 /100 | #62 | Exceptional $61,040 |
| Immigrants | Pakistan | 99.8 /100 | #63 | Exceptional $60,987 |
| Immigrants | Eastern Europe | 99.8 /100 | #64 | Exceptional $60,958 |
| Immigrants | Indonesia | 99.8 /100 | #65 | Exceptional $60,935 |
| Immigrants | Croatia | 99.8 /100 | #66 | Exceptional $60,914 |
| Immigrants | Spain | 99.8 /100 | #67 | Exceptional $60,750 |
| Immigrants | Serbia | 99.7 /100 | #68 | Exceptional $60,600 |
| Immigrants | Canada | 99.7 /100 | #69 | Exceptional $60,388 |
| Immigrants | Bulgaria | 99.7 /100 | #70 | Exceptional $60,358 |
| Mongolians | 99.7 /100 | #71 | Exceptional $60,350 |
| Immigrants | Western Europe | 99.7 /100 | #72 | Exceptional $60,334 |
| Immigrants | North America | 99.7 /100 | #73 | Exceptional $60,265 |
| Argentineans | 99.6 /100 | #74 | Exceptional $60,117 |
| Immigrants | Bolivia | 99.6 /100 | #75 | Exceptional $60,088 |
| Romanians | 99.6 /100 | #76 | Exceptional $60,063 |
| Paraguayans | 99.5 /100 | #77 | Exceptional $59,975 |
| Immigrants | Egypt | 99.5 /100 | #78 | Exceptional $59,925 |
| Immigrants | Ukraine | 99.5 /100 | #79 | Exceptional $59,820 |