Chilean vs Immigrants from Ukraine Median Male Earnings
COMPARE
Chilean
Immigrants from Ukraine
Median Male Earnings
Median Male Earnings Comparison
Chileans
Immigrants from Ukraine
$56,973
MEDIAN MALE EARNINGS
91.9/ 100
METRIC RATING
124th/ 347
METRIC RANK
$59,820
MEDIAN MALE EARNINGS
99.5/ 100
METRIC RATING
79th/ 347
METRIC RANK
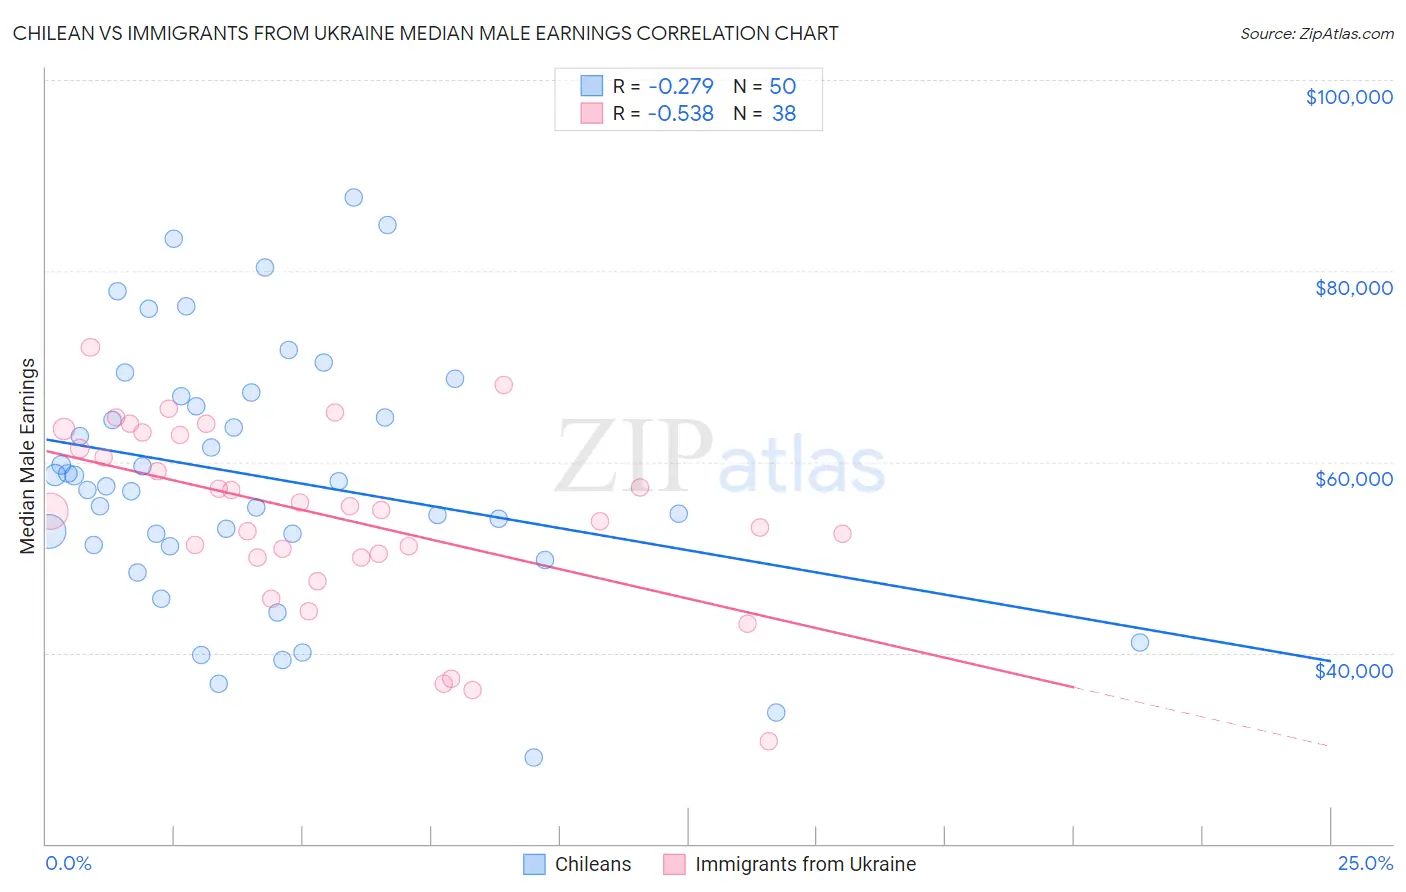
Chilean vs Immigrants from Ukraine Median Male Earnings Correlation Chart
The statistical analysis conducted on geographies consisting of 256,627,100 people shows a weak negative correlation between the proportion of Chileans and median male earnings in the United States with a correlation coefficient (R) of -0.279 and weighted average of $56,973. Similarly, the statistical analysis conducted on geographies consisting of 289,634,728 people shows a substantial negative correlation between the proportion of Immigrants from Ukraine and median male earnings in the United States with a correlation coefficient (R) of -0.538 and weighted average of $59,820, a difference of 5.0%.
Median Male Earnings Correlation Summary
| Measurement | Chilean | Immigrants from Ukraine |
| Minimum | $29,032 | $30,721 |
| Maximum | $87,679 | $71,961 |
| Range | $58,647 | $41,240 |
| Mean | $58,454 | $54,290 |
| Median | $57,750 | $54,853 |
| Interquartile 25% (IQ1) | $51,349 | $49,956 |
| Interquartile 75% (IQ3) | $66,830 | $62,824 |
| Interquartile Range (IQR) | $15,482 | $12,868 |
| Standard Deviation (Sample) | $13,319 | $9,509 |
| Standard Deviation (Population) | $13,185 | $9,383 |
Similar Demographics by Median Male Earnings
Demographics Similar to Chileans by Median Male Earnings
In terms of median male earnings, the demographic groups most similar to Chileans are Immigrants from Morocco ($56,958, a difference of 0.030%), Chinese ($56,872, a difference of 0.18%), Brazilian ($56,837, a difference of 0.24%), Immigrants from Syria ($56,830, a difference of 0.25%), and Immigrants from Jordan ($57,145, a difference of 0.30%).
| Demographics | Rating | Rank | Median Male Earnings |
| Immigrants | Zimbabwe | 94.3 /100 | #117 | Exceptional $57,352 |
| Hungarians | 94.0 /100 | #118 | Exceptional $57,309 |
| Arabs | 94.0 /100 | #119 | Exceptional $57,298 |
| Canadians | 93.9 /100 | #120 | Exceptional $57,286 |
| Immigrants | Albania | 93.3 /100 | #121 | Exceptional $57,179 |
| Immigrants | Jordan | 93.1 /100 | #122 | Exceptional $57,145 |
| Slovenes | 93.1 /100 | #123 | Exceptional $57,145 |
| Chileans | 91.9 /100 | #124 | Exceptional $56,973 |
| Immigrants | Morocco | 91.8 /100 | #125 | Exceptional $56,958 |
| Chinese | 91.1 /100 | #126 | Exceptional $56,872 |
| Brazilians | 90.9 /100 | #127 | Exceptional $56,837 |
| Immigrants | Syria | 90.8 /100 | #128 | Exceptional $56,830 |
| Pakistanis | 89.9 /100 | #129 | Excellent $56,719 |
| Koreans | 89.4 /100 | #130 | Excellent $56,672 |
| Portuguese | 89.4 /100 | #131 | Excellent $56,663 |
Demographics Similar to Immigrants from Ukraine by Median Male Earnings
In terms of median male earnings, the demographic groups most similar to Immigrants from Ukraine are Immigrants from Hungary ($59,806, a difference of 0.020%), Ukrainian ($59,728, a difference of 0.16%), Immigrants from Egypt ($59,925, a difference of 0.18%), Croatian ($59,715, a difference of 0.18%), and Immigrants from Italy ($59,691, a difference of 0.22%).
| Demographics | Rating | Rank | Median Male Earnings |
| Immigrants | Western Europe | 99.7 /100 | #72 | Exceptional $60,334 |
| Immigrants | North America | 99.7 /100 | #73 | Exceptional $60,265 |
| Argentineans | 99.6 /100 | #74 | Exceptional $60,117 |
| Immigrants | Bolivia | 99.6 /100 | #75 | Exceptional $60,088 |
| Romanians | 99.6 /100 | #76 | Exceptional $60,063 |
| Paraguayans | 99.5 /100 | #77 | Exceptional $59,975 |
| Immigrants | Egypt | 99.5 /100 | #78 | Exceptional $59,925 |
| Immigrants | Ukraine | 99.5 /100 | #79 | Exceptional $59,820 |
| Immigrants | Hungary | 99.5 /100 | #80 | Exceptional $59,806 |
| Ukrainians | 99.4 /100 | #81 | Exceptional $59,728 |
| Croatians | 99.4 /100 | #82 | Exceptional $59,715 |
| Immigrants | Italy | 99.4 /100 | #83 | Exceptional $59,691 |
| Afghans | 99.3 /100 | #84 | Exceptional $59,554 |
| Italians | 99.3 /100 | #85 | Exceptional $59,551 |
| Immigrants | England | 99.3 /100 | #86 | Exceptional $59,527 |