Palestinian vs Immigrants from Latvia Family Households with Children
COMPARE
Palestinian
Immigrants from Latvia
Family Households with Children
Family Households with Children Comparison
Palestinians
Immigrants from Latvia
28.1%
FAMILY HOUSEHOLDS WITH CHILDREN
98.5/ 100
METRIC RATING
103rd/ 347
METRIC RANK
25.9%
FAMILY HOUSEHOLDS WITH CHILDREN
0.0/ 100
METRIC RATING
330th/ 347
METRIC RANK
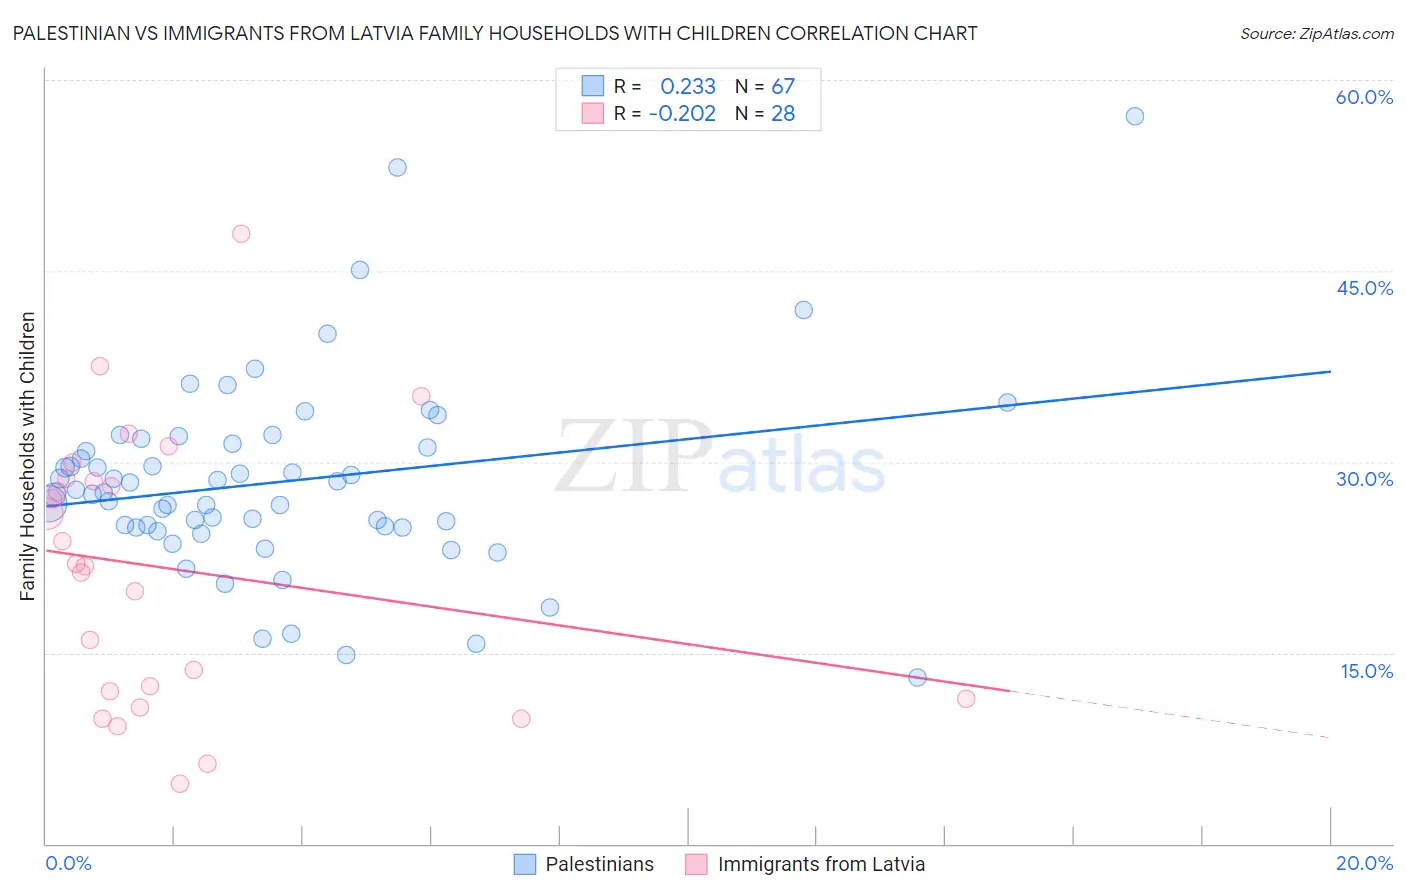
Palestinian vs Immigrants from Latvia Family Households with Children Correlation Chart
The statistical analysis conducted on geographies consisting of 216,372,515 people shows a weak positive correlation between the proportion of Palestinians and percentage of family households with children in the United States with a correlation coefficient (R) of 0.233 and weighted average of 28.1%. Similarly, the statistical analysis conducted on geographies consisting of 113,723,252 people shows a weak negative correlation between the proportion of Immigrants from Latvia and percentage of family households with children in the United States with a correlation coefficient (R) of -0.202 and weighted average of 25.9%, a difference of 8.6%.
Family Households with Children Correlation Summary
| Measurement | Palestinian | Immigrants from Latvia |
| Minimum | 13.1% | 4.7% |
| Maximum | 57.1% | 48.0% |
| Range | 44.1% | 43.3% |
| Mean | 28.4% | 21.6% |
| Median | 27.6% | 21.9% |
| Interquartile 25% (IQ1) | 24.9% | 11.7% |
| Interquartile 75% (IQ3) | 31.4% | 28.6% |
| Interquartile Range (IQR) | 6.5% | 16.9% |
| Standard Deviation (Sample) | 7.6% | 10.7% |
| Standard Deviation (Population) | 7.6% | 10.5% |
Similar Demographics by Family Households with Children
Demographics Similar to Palestinians by Family Households with Children
In terms of family households with children, the demographic groups most similar to Palestinians are Sioux (28.1%, a difference of 0.050%), Choctaw (28.1%, a difference of 0.050%), Assyrian/Chaldean/Syriac (28.1%, a difference of 0.10%), Immigrants from Oceania (28.1%, a difference of 0.13%), and Immigrants from the Azores (28.1%, a difference of 0.15%).
| Demographics | Rating | Rank | Family Households with Children |
| Ute | 99.1 /100 | #96 | Exceptional 28.2% |
| Chileans | 98.9 /100 | #97 | Exceptional 28.1% |
| Immigrants | Kenya | 98.9 /100 | #98 | Exceptional 28.1% |
| Immigrants | Azores | 98.8 /100 | #99 | Exceptional 28.1% |
| Indonesians | 98.8 /100 | #100 | Exceptional 28.1% |
| Immigrants | Oceania | 98.8 /100 | #101 | Exceptional 28.1% |
| Assyrians/Chaldeans/Syriacs | 98.7 /100 | #102 | Exceptional 28.1% |
| Palestinians | 98.5 /100 | #103 | Exceptional 28.1% |
| Sioux | 98.3 /100 | #104 | Exceptional 28.1% |
| Choctaw | 98.3 /100 | #105 | Exceptional 28.1% |
| Immigrants | South America | 98.0 /100 | #106 | Exceptional 28.0% |
| Immigrants | Uganda | 97.7 /100 | #107 | Exceptional 28.0% |
| Immigrants | Burma/Myanmar | 97.7 /100 | #108 | Exceptional 28.0% |
| Tohono O'odham | 97.6 /100 | #109 | Exceptional 28.0% |
| Spaniards | 97.4 /100 | #110 | Exceptional 28.0% |
Demographics Similar to Immigrants from Latvia by Family Households with Children
In terms of family households with children, the demographic groups most similar to Immigrants from Latvia are Slovene (25.8%, a difference of 0.13%), Cypriot (25.9%, a difference of 0.18%), Immigrants from Albania (25.9%, a difference of 0.31%), Immigrants from Austria (25.8%, a difference of 0.36%), and Immigrants from Barbados (26.0%, a difference of 0.41%).
| Demographics | Rating | Rank | Family Households with Children |
| Immigrants | Australia | 0.0 /100 | #323 | Tragic 26.0% |
| Chinese | 0.0 /100 | #324 | Tragic 26.0% |
| Barbadians | 0.0 /100 | #325 | Tragic 26.0% |
| Immigrants | Ireland | 0.0 /100 | #326 | Tragic 26.0% |
| Immigrants | Barbados | 0.0 /100 | #327 | Tragic 26.0% |
| Immigrants | Albania | 0.0 /100 | #328 | Tragic 25.9% |
| Cypriots | 0.0 /100 | #329 | Tragic 25.9% |
| Immigrants | Latvia | 0.0 /100 | #330 | Tragic 25.9% |
| Slovenes | 0.0 /100 | #331 | Tragic 25.8% |
| Immigrants | Austria | 0.0 /100 | #332 | Tragic 25.8% |
| Immigrants | Switzerland | 0.0 /100 | #333 | Tragic 25.7% |
| Slovaks | 0.0 /100 | #334 | Tragic 25.7% |
| Immigrants | Croatia | 0.0 /100 | #335 | Tragic 25.7% |
| Immigrants | West Indies | 0.0 /100 | #336 | Tragic 25.7% |
| Puerto Ricans | 0.0 /100 | #337 | Tragic 25.6% |