English vs Immigrants from Haiti Median Household Income
COMPARE
English
Immigrants from Haiti
Median Household Income
Median Household Income Comparison
English
Immigrants from Haiti
$84,915
MEDIAN HOUSEHOLD INCOME
47.0/ 100
METRIC RATING
179th/ 347
METRIC RANK
$72,599
MEDIAN HOUSEHOLD INCOME
0.0/ 100
METRIC RATING
304th/ 347
METRIC RANK
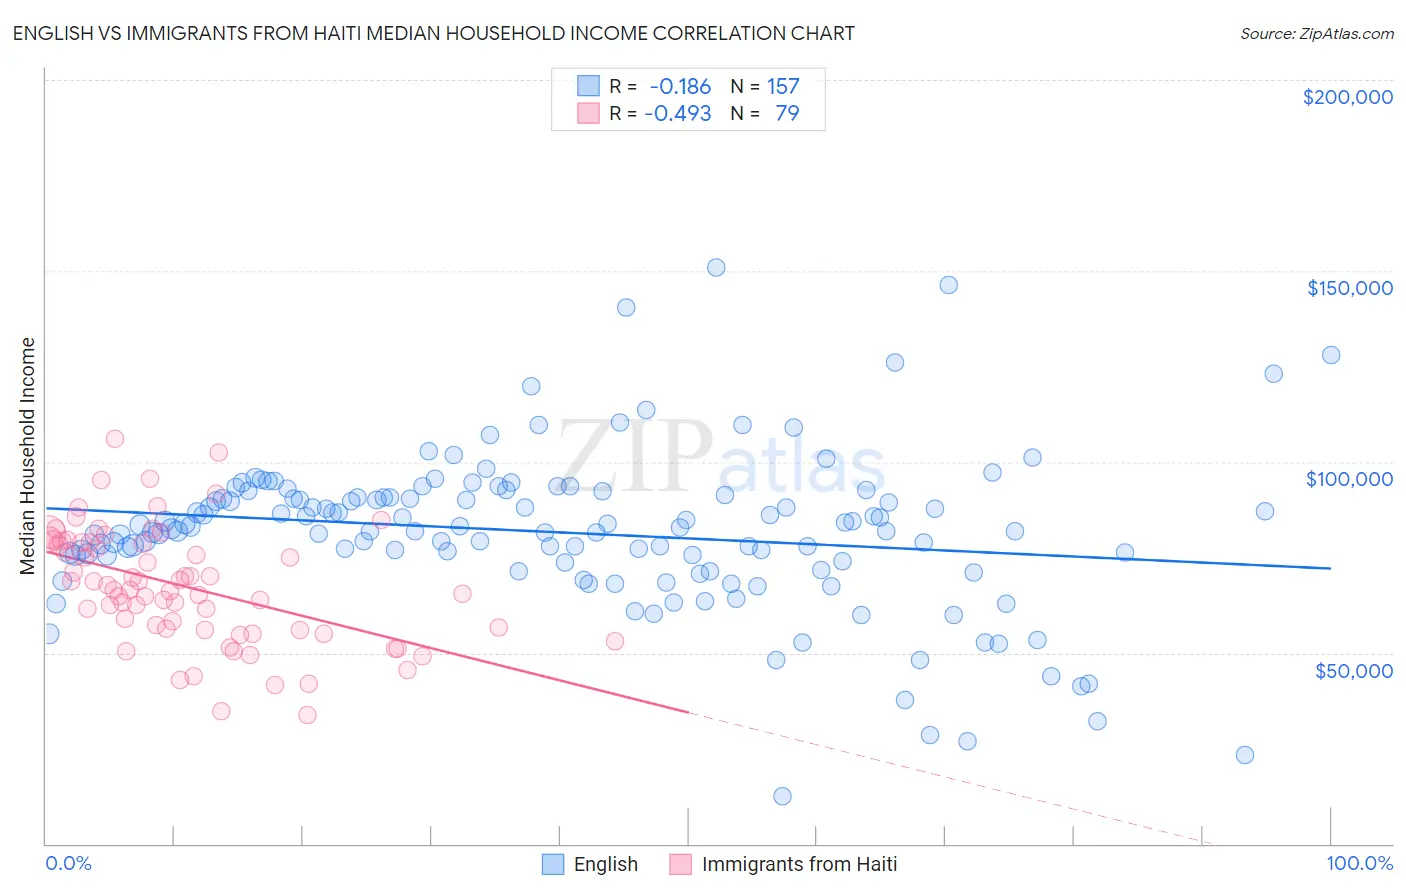
English vs Immigrants from Haiti Median Household Income Correlation Chart
The statistical analysis conducted on geographies consisting of 578,383,901 people shows a poor negative correlation between the proportion of English and median household income in the United States with a correlation coefficient (R) of -0.186 and weighted average of $84,915. Similarly, the statistical analysis conducted on geographies consisting of 225,133,235 people shows a moderate negative correlation between the proportion of Immigrants from Haiti and median household income in the United States with a correlation coefficient (R) of -0.493 and weighted average of $72,599, a difference of 17.0%.
Median Household Income Correlation Summary
| Measurement | English | Immigrants from Haiti |
| Minimum | $12,326 | $33,629 |
| Maximum | $150,805 | $105,986 |
| Range | $138,479 | $72,357 |
| Mean | $81,510 | $67,399 |
| Median | $82,609 | $66,369 |
| Interquartile 25% (IQ1) | $73,869 | $56,044 |
| Interquartile 75% (IQ3) | $90,807 | $78,973 |
| Interquartile Range (IQR) | $16,938 | $22,929 |
| Standard Deviation (Sample) | $20,635 | $15,193 |
| Standard Deviation (Population) | $20,569 | $15,096 |
Similar Demographics by Median Household Income
Demographics Similar to English by Median Household Income
In terms of median household income, the demographic groups most similar to English are Czechoslovakian ($84,965, a difference of 0.060%), Immigrants from Eritrea ($85,025, a difference of 0.13%), Immigrants from Costa Rica ($85,054, a difference of 0.16%), Alsatian ($85,053, a difference of 0.16%), and Immigrants from Portugal ($84,740, a difference of 0.21%).
| Demographics | Rating | Rank | Median Household Income |
| Slovenes | 57.4 /100 | #172 | Average $85,562 |
| Immigrants | Cameroon | 53.4 /100 | #173 | Average $85,314 |
| Scottish | 50.0 /100 | #174 | Average $85,101 |
| Immigrants | Costa Rica | 49.2 /100 | #175 | Average $85,054 |
| Alsatians | 49.2 /100 | #176 | Average $85,053 |
| Immigrants | Eritrea | 48.8 /100 | #177 | Average $85,025 |
| Czechoslovakians | 47.8 /100 | #178 | Average $84,965 |
| English | 47.0 /100 | #179 | Average $84,915 |
| Immigrants | Portugal | 44.2 /100 | #180 | Average $84,740 |
| Hawaiians | 44.1 /100 | #181 | Average $84,729 |
| Uruguayans | 43.5 /100 | #182 | Average $84,691 |
| Spaniards | 42.7 /100 | #183 | Average $84,644 |
| Immigrants | Eastern Africa | 37.4 /100 | #184 | Fair $84,299 |
| Kenyans | 34.2 /100 | #185 | Fair $84,085 |
| Puget Sound Salish | 33.2 /100 | #186 | Fair $84,011 |
Demographics Similar to Immigrants from Haiti by Median Household Income
In terms of median household income, the demographic groups most similar to Immigrants from Haiti are Honduran ($72,588, a difference of 0.020%), Potawatomi ($72,576, a difference of 0.030%), African ($72,650, a difference of 0.070%), Shoshone ($72,660, a difference of 0.080%), and Cherokee ($72,682, a difference of 0.11%).
| Demographics | Rating | Rank | Median Household Income |
| Immigrants | Mexico | 0.0 /100 | #297 | Tragic $73,160 |
| Paiute | 0.0 /100 | #298 | Tragic $72,959 |
| Indonesians | 0.0 /100 | #299 | Tragic $72,856 |
| Immigrants | Dominica | 0.0 /100 | #300 | Tragic $72,760 |
| Cherokee | 0.0 /100 | #301 | Tragic $72,682 |
| Shoshone | 0.0 /100 | #302 | Tragic $72,660 |
| Africans | 0.0 /100 | #303 | Tragic $72,650 |
| Immigrants | Haiti | 0.0 /100 | #304 | Tragic $72,599 |
| Hondurans | 0.0 /100 | #305 | Tragic $72,588 |
| Potawatomi | 0.0 /100 | #306 | Tragic $72,576 |
| Ute | 0.0 /100 | #307 | Tragic $72,402 |
| Yakama | 0.0 /100 | #308 | Tragic $72,225 |
| Immigrants | Caribbean | 0.0 /100 | #309 | Tragic $71,860 |
| U.S. Virgin Islanders | 0.0 /100 | #310 | Tragic $71,853 |
| Immigrants | Zaire | 0.0 /100 | #311 | Tragic $71,801 |