Palestinian vs Immigrants from Haiti Householder Income Under 25 years
COMPARE
Palestinian
Immigrants from Haiti
Householder Income Under 25 years
Householder Income Under 25 years Comparison
Palestinians
Immigrants from Haiti
$51,515
HOUSEHOLDER INCOME UNDER 25 YEARS
16.1/ 100
METRIC RATING
196th/ 347
METRIC RANK
$50,398
HOUSEHOLDER INCOME UNDER 25 YEARS
1.2/ 100
METRIC RATING
253rd/ 347
METRIC RANK
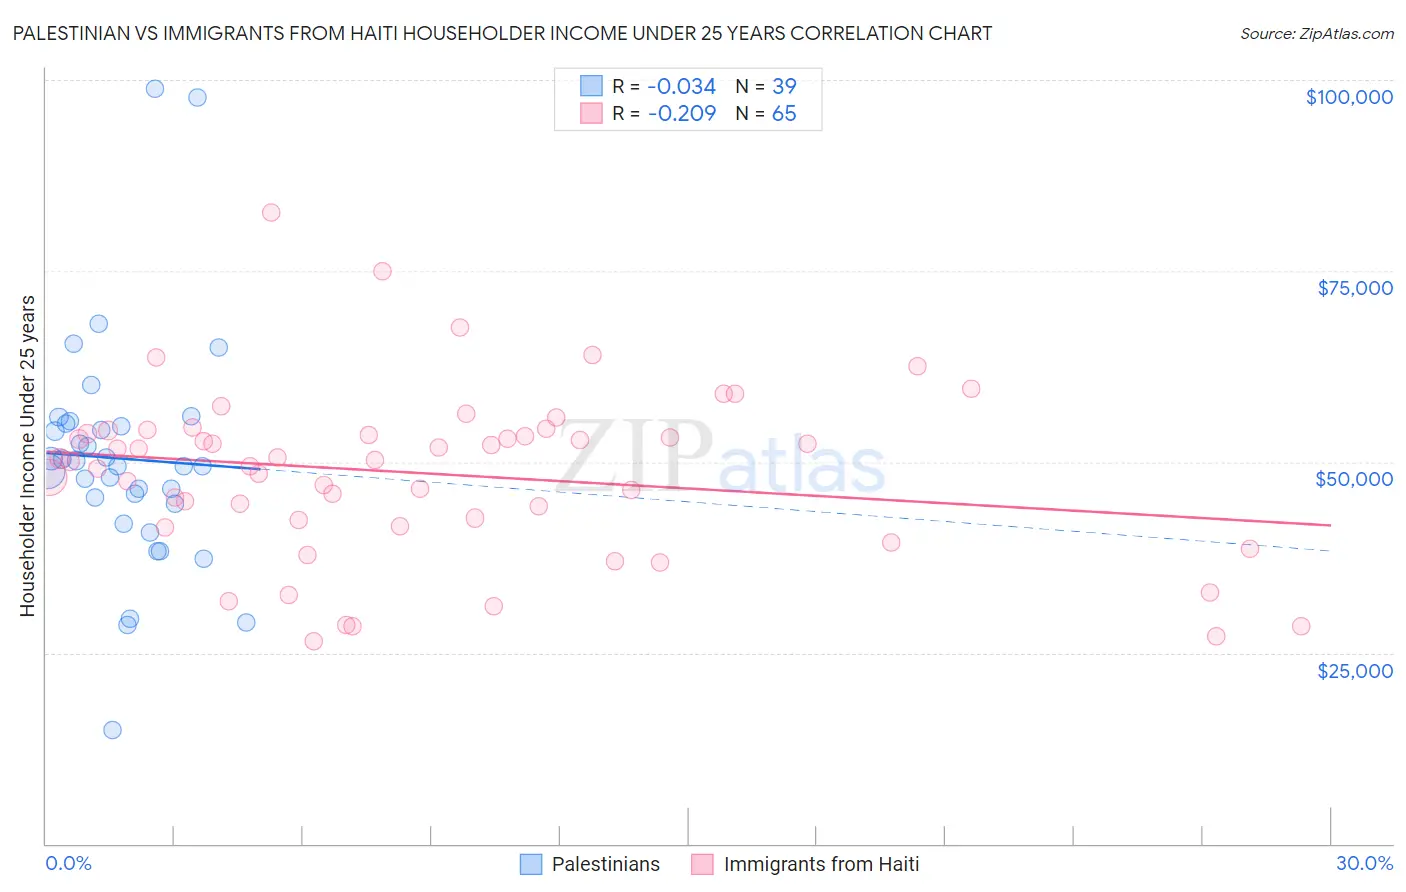
Palestinian vs Immigrants from Haiti Householder Income Under 25 years Correlation Chart
The statistical analysis conducted on geographies consisting of 193,687,926 people shows no correlation between the proportion of Palestinians and household income with householder under the age of 25 in the United States with a correlation coefficient (R) of -0.034 and weighted average of $51,515. Similarly, the statistical analysis conducted on geographies consisting of 194,658,893 people shows a weak negative correlation between the proportion of Immigrants from Haiti and household income with householder under the age of 25 in the United States with a correlation coefficient (R) of -0.209 and weighted average of $50,398, a difference of 2.2%.
Householder Income Under 25 years Correlation Summary
| Measurement | Palestinian | Immigrants from Haiti |
| Minimum | $14,826 | $26,470 |
| Maximum | $98,850 | $82,635 |
| Range | $84,024 | $56,166 |
| Mean | $50,413 | $48,468 |
| Median | $49,499 | $50,234 |
| Interquartile 25% (IQ1) | $44,436 | $41,992 |
| Interquartile 75% (IQ3) | $54,961 | $53,925 |
| Interquartile Range (IQR) | $10,525 | $11,932 |
| Standard Deviation (Sample) | $15,380 | $11,076 |
| Standard Deviation (Population) | $15,181 | $10,991 |
Similar Demographics by Householder Income Under 25 years
Demographics Similar to Palestinians by Householder Income Under 25 years
In terms of householder income under 25 years, the demographic groups most similar to Palestinians are Guatemalan ($51,525, a difference of 0.020%), Estonian ($51,523, a difference of 0.020%), Pima ($51,503, a difference of 0.020%), Immigrants from Syria ($51,494, a difference of 0.040%), and Swiss ($51,493, a difference of 0.040%).
| Demographics | Rating | Rank | Householder Income Under 25 years |
| Croatians | 21.6 /100 | #189 | Fair $51,662 |
| Malaysians | 19.7 /100 | #190 | Poor $51,615 |
| Panamanians | 19.5 /100 | #191 | Poor $51,611 |
| West Indians | 18.5 /100 | #192 | Poor $51,583 |
| Immigrants | Eritrea | 18.1 /100 | #193 | Poor $51,574 |
| Guatemalans | 16.4 /100 | #194 | Poor $51,525 |
| Estonians | 16.4 /100 | #195 | Poor $51,523 |
| Palestinians | 16.1 /100 | #196 | Poor $51,515 |
| Pima | 15.7 /100 | #197 | Poor $51,503 |
| Immigrants | Syria | 15.4 /100 | #198 | Poor $51,494 |
| Swiss | 15.4 /100 | #199 | Poor $51,493 |
| Immigrants | West Indies | 14.9 /100 | #200 | Poor $51,479 |
| British | 14.9 /100 | #201 | Poor $51,477 |
| Immigrants | Guatemala | 14.0 /100 | #202 | Poor $51,447 |
| Immigrants | Cameroon | 13.6 /100 | #203 | Poor $51,433 |
Demographics Similar to Immigrants from Haiti by Householder Income Under 25 years
In terms of householder income under 25 years, the demographic groups most similar to Immigrants from Haiti are Luxembourger ($50,379, a difference of 0.040%), Aleut ($50,377, a difference of 0.040%), Immigrants from Mexico ($50,422, a difference of 0.050%), Immigrants from Cuba ($50,374, a difference of 0.050%), and Lebanese ($50,355, a difference of 0.090%).
| Demographics | Rating | Rank | Householder Income Under 25 years |
| Welsh | 2.0 /100 | #246 | Tragic $50,597 |
| Immigrants | Bosnia and Herzegovina | 1.8 /100 | #247 | Tragic $50,565 |
| Slavs | 1.8 /100 | #248 | Tragic $50,563 |
| Scottish | 1.8 /100 | #249 | Tragic $50,554 |
| Immigrants | Cabo Verde | 1.7 /100 | #250 | Tragic $50,520 |
| Celtics | 1.4 /100 | #251 | Tragic $50,447 |
| Immigrants | Mexico | 1.3 /100 | #252 | Tragic $50,422 |
| Immigrants | Haiti | 1.2 /100 | #253 | Tragic $50,398 |
| Luxembourgers | 1.2 /100 | #254 | Tragic $50,379 |
| Aleuts | 1.2 /100 | #255 | Tragic $50,377 |
| Immigrants | Cuba | 1.2 /100 | #256 | Tragic $50,374 |
| Lebanese | 1.1 /100 | #257 | Tragic $50,355 |
| Whites/Caucasians | 1.1 /100 | #258 | Tragic $50,336 |
| Immigrants | Dominica | 1.0 /100 | #259 | Tragic $50,301 |
| Hispanics or Latinos | 0.9 /100 | #260 | Tragic $50,279 |