Pakistani vs Immigrants from Spain Median Household Income
COMPARE
Pakistani
Immigrants from Spain
Median Household Income
Median Household Income Comparison
Pakistanis
Immigrants from Spain
$89,638
MEDIAN HOUSEHOLD INCOME
94.8/ 100
METRIC RATING
122nd/ 347
METRIC RANK
$92,732
MEDIAN HOUSEHOLD INCOME
99.3/ 100
METRIC RATING
82nd/ 347
METRIC RANK
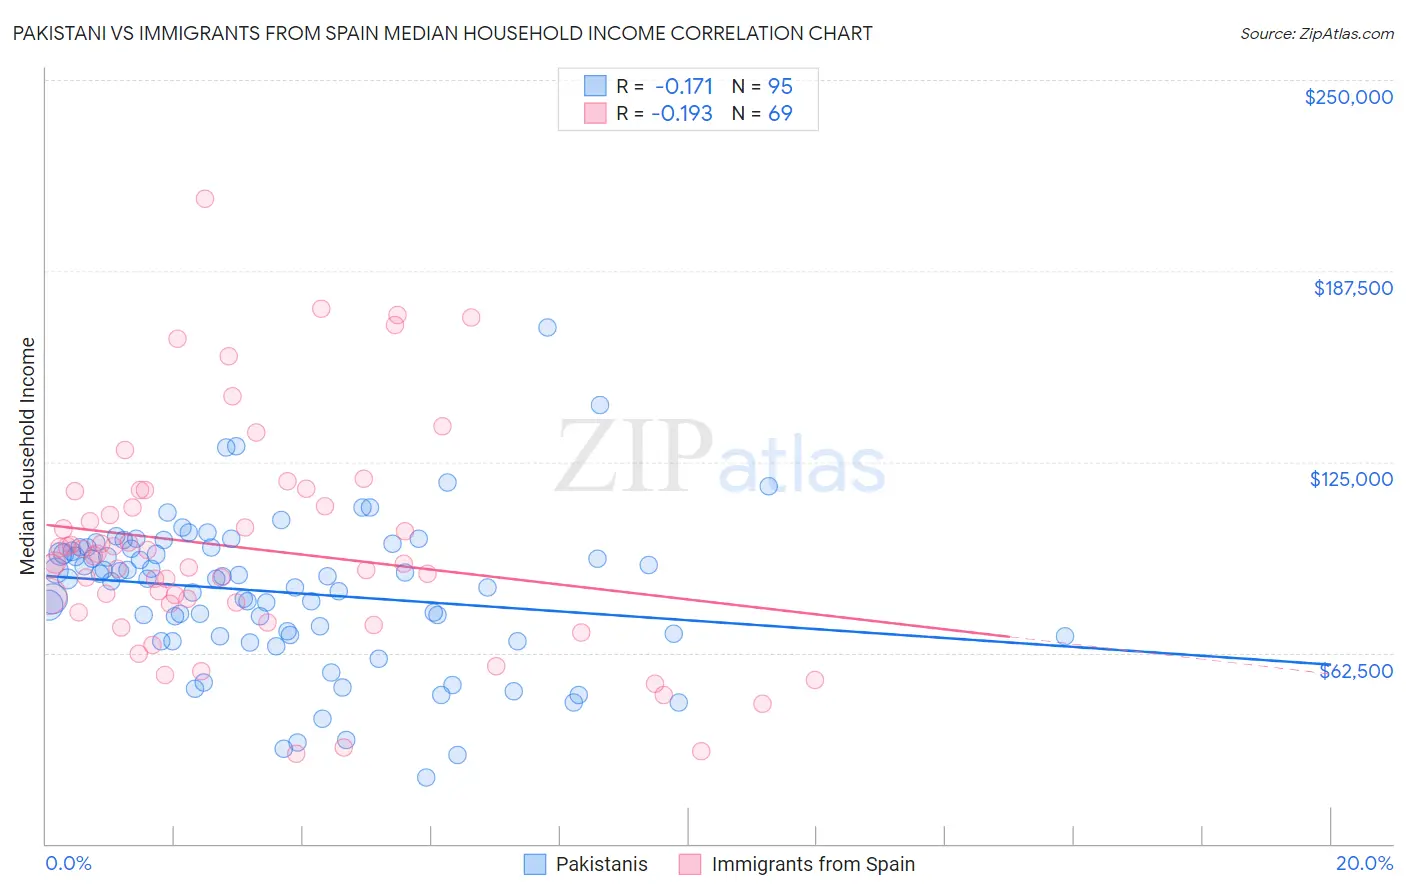
Pakistani vs Immigrants from Spain Median Household Income Correlation Chart
The statistical analysis conducted on geographies consisting of 335,154,769 people shows a poor negative correlation between the proportion of Pakistanis and median household income in the United States with a correlation coefficient (R) of -0.171 and weighted average of $89,638. Similarly, the statistical analysis conducted on geographies consisting of 239,554,501 people shows a poor negative correlation between the proportion of Immigrants from Spain and median household income in the United States with a correlation coefficient (R) of -0.193 and weighted average of $92,732, a difference of 3.5%.
Median Household Income Correlation Summary
| Measurement | Pakistani | Immigrants from Spain |
| Minimum | $21,500 | $29,291 |
| Maximum | $169,063 | $211,250 |
| Range | $147,563 | $181,959 |
| Mean | $82,388 | $96,765 |
| Median | $86,853 | $92,124 |
| Interquartile 25% (IQ1) | $68,125 | $77,194 |
| Interquartile 75% (IQ3) | $96,894 | $112,999 |
| Interquartile Range (IQR) | $28,769 | $35,805 |
| Standard Deviation (Sample) | $24,553 | $36,186 |
| Standard Deviation (Population) | $24,423 | $35,922 |
Similar Demographics by Median Household Income
Demographics Similar to Pakistanis by Median Household Income
In terms of median household income, the demographic groups most similar to Pakistanis are Ethiopian ($89,640, a difference of 0.0%), Immigrants from North Macedonia ($89,741, a difference of 0.11%), Albanian ($89,744, a difference of 0.12%), Immigrants from Zimbabwe ($89,496, a difference of 0.16%), and Syrian ($89,830, a difference of 0.21%).
| Demographics | Rating | Rank | Median Household Income |
| Immigrants | Western Asia | 95.9 /100 | #115 | Exceptional $90,005 |
| Native Hawaiians | 95.7 /100 | #116 | Exceptional $89,919 |
| Taiwanese | 95.6 /100 | #117 | Exceptional $89,900 |
| Syrians | 95.4 /100 | #118 | Exceptional $89,830 |
| Albanians | 95.2 /100 | #119 | Exceptional $89,744 |
| Immigrants | North Macedonia | 95.2 /100 | #120 | Exceptional $89,741 |
| Ethiopians | 94.9 /100 | #121 | Exceptional $89,640 |
| Pakistanis | 94.8 /100 | #122 | Exceptional $89,638 |
| Immigrants | Zimbabwe | 94.4 /100 | #123 | Exceptional $89,496 |
| Immigrants | Jordan | 94.1 /100 | #124 | Exceptional $89,412 |
| Immigrants | Kuwait | 93.5 /100 | #125 | Exceptional $89,263 |
| Immigrants | Oceania | 92.9 /100 | #126 | Exceptional $89,100 |
| Immigrants | Peru | 92.5 /100 | #127 | Exceptional $89,010 |
| Portuguese | 92.3 /100 | #128 | Exceptional $88,976 |
| Brazilians | 92.1 /100 | #129 | Exceptional $88,934 |
Demographics Similar to Immigrants from Spain by Median Household Income
In terms of median household income, the demographic groups most similar to Immigrants from Spain are Italian ($92,475, a difference of 0.28%), Immigrants from Eastern Europe ($93,051, a difference of 0.34%), Immigrants from Argentina ($92,417, a difference of 0.34%), Tongan ($93,076, a difference of 0.37%), and Sri Lankan ($93,093, a difference of 0.39%).
| Demographics | Rating | Rank | Median Household Income |
| Immigrants | Italy | 99.5 /100 | #75 | Exceptional $93,465 |
| South Africans | 99.5 /100 | #76 | Exceptional $93,379 |
| Immigrants | Afghanistan | 99.5 /100 | #77 | Exceptional $93,375 |
| Immigrants | Bulgaria | 99.4 /100 | #78 | Exceptional $93,148 |
| Sri Lankans | 99.4 /100 | #79 | Exceptional $93,093 |
| Tongans | 99.4 /100 | #80 | Exceptional $93,076 |
| Immigrants | Eastern Europe | 99.4 /100 | #81 | Exceptional $93,051 |
| Immigrants | Spain | 99.3 /100 | #82 | Exceptional $92,732 |
| Italians | 99.1 /100 | #83 | Exceptional $92,475 |
| Immigrants | Argentina | 99.1 /100 | #84 | Exceptional $92,417 |
| Immigrants | Croatia | 99.0 /100 | #85 | Exceptional $92,225 |
| Immigrants | England | 98.9 /100 | #86 | Exceptional $92,098 |
| Immigrants | Hungary | 98.9 /100 | #87 | Exceptional $92,094 |
| Immigrants | Canada | 98.8 /100 | #88 | Exceptional $92,029 |
| Romanians | 98.8 /100 | #89 | Exceptional $91,994 |