Pakistani vs Immigrants from Nigeria Median Household Income
COMPARE
Pakistani
Immigrants from Nigeria
Median Household Income
Median Household Income Comparison
Pakistanis
Immigrants from Nigeria
$89,638
MEDIAN HOUSEHOLD INCOME
94.8/ 100
METRIC RATING
122nd/ 347
METRIC RANK
$81,236
MEDIAN HOUSEHOLD INCOME
7.7/ 100
METRIC RATING
222nd/ 347
METRIC RANK
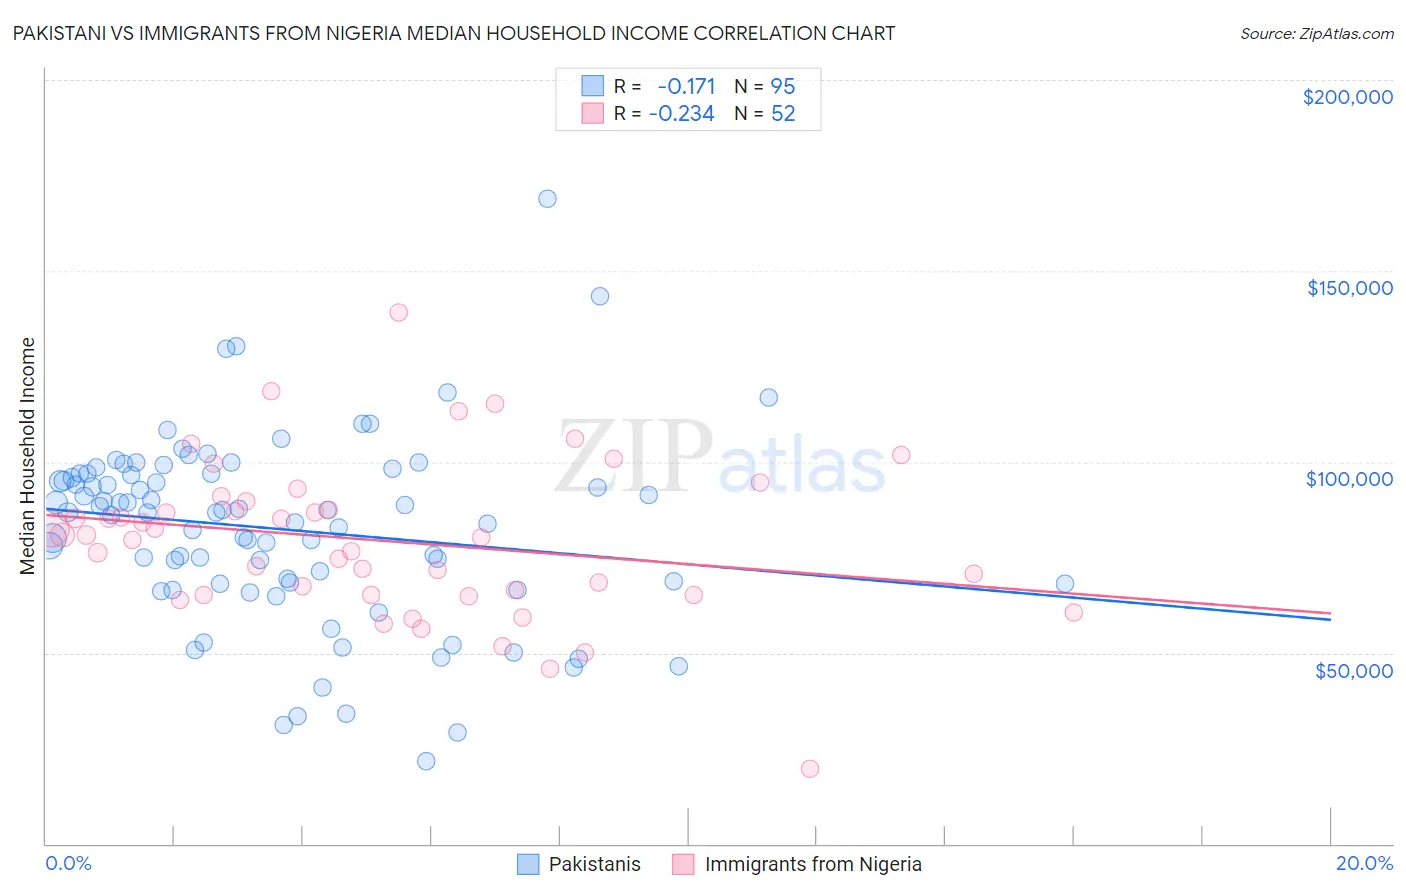
Pakistani vs Immigrants from Nigeria Median Household Income Correlation Chart
The statistical analysis conducted on geographies consisting of 335,154,769 people shows a poor negative correlation between the proportion of Pakistanis and median household income in the United States with a correlation coefficient (R) of -0.171 and weighted average of $89,638. Similarly, the statistical analysis conducted on geographies consisting of 283,225,999 people shows a weak negative correlation between the proportion of Immigrants from Nigeria and median household income in the United States with a correlation coefficient (R) of -0.234 and weighted average of $81,236, a difference of 10.3%.
Median Household Income Correlation Summary
| Measurement | Pakistani | Immigrants from Nigeria |
| Minimum | $21,500 | $19,722 |
| Maximum | $169,063 | $139,152 |
| Range | $147,563 | $119,430 |
| Mean | $82,388 | $79,398 |
| Median | $86,853 | $80,475 |
| Interquartile 25% (IQ1) | $68,125 | $65,224 |
| Interquartile 75% (IQ3) | $96,894 | $88,599 |
| Interquartile Range (IQR) | $28,769 | $23,375 |
| Standard Deviation (Sample) | $24,553 | $20,570 |
| Standard Deviation (Population) | $24,423 | $20,371 |
Similar Demographics by Median Household Income
Demographics Similar to Pakistanis by Median Household Income
In terms of median household income, the demographic groups most similar to Pakistanis are Ethiopian ($89,640, a difference of 0.0%), Immigrants from North Macedonia ($89,741, a difference of 0.11%), Albanian ($89,744, a difference of 0.12%), Immigrants from Zimbabwe ($89,496, a difference of 0.16%), and Syrian ($89,830, a difference of 0.21%).
| Demographics | Rating | Rank | Median Household Income |
| Immigrants | Western Asia | 95.9 /100 | #115 | Exceptional $90,005 |
| Native Hawaiians | 95.7 /100 | #116 | Exceptional $89,919 |
| Taiwanese | 95.6 /100 | #117 | Exceptional $89,900 |
| Syrians | 95.4 /100 | #118 | Exceptional $89,830 |
| Albanians | 95.2 /100 | #119 | Exceptional $89,744 |
| Immigrants | North Macedonia | 95.2 /100 | #120 | Exceptional $89,741 |
| Ethiopians | 94.9 /100 | #121 | Exceptional $89,640 |
| Pakistanis | 94.8 /100 | #122 | Exceptional $89,638 |
| Immigrants | Zimbabwe | 94.4 /100 | #123 | Exceptional $89,496 |
| Immigrants | Jordan | 94.1 /100 | #124 | Exceptional $89,412 |
| Immigrants | Kuwait | 93.5 /100 | #125 | Exceptional $89,263 |
| Immigrants | Oceania | 92.9 /100 | #126 | Exceptional $89,100 |
| Immigrants | Peru | 92.5 /100 | #127 | Exceptional $89,010 |
| Portuguese | 92.3 /100 | #128 | Exceptional $88,976 |
| Brazilians | 92.1 /100 | #129 | Exceptional $88,934 |
Demographics Similar to Immigrants from Nigeria by Median Household Income
In terms of median household income, the demographic groups most similar to Immigrants from Nigeria are Immigrants from El Salvador ($81,213, a difference of 0.030%), Malaysian ($81,064, a difference of 0.21%), Immigrants from Ghana ($81,489, a difference of 0.31%), Immigrants from Venezuela ($81,506, a difference of 0.33%), and Scotch-Irish ($80,972, a difference of 0.33%).
| Demographics | Rating | Rank | Median Household Income |
| Vietnamese | 13.8 /100 | #215 | Poor $82,248 |
| Yugoslavians | 13.3 /100 | #216 | Poor $82,186 |
| Ecuadorians | 12.5 /100 | #217 | Poor $82,070 |
| Whites/Caucasians | 12.2 /100 | #218 | Poor $82,029 |
| Nigerians | 10.3 /100 | #219 | Poor $81,725 |
| Immigrants | Venezuela | 9.0 /100 | #220 | Tragic $81,506 |
| Immigrants | Ghana | 9.0 /100 | #221 | Tragic $81,489 |
| Immigrants | Nigeria | 7.7 /100 | #222 | Tragic $81,236 |
| Immigrants | El Salvador | 7.6 /100 | #223 | Tragic $81,213 |
| Malaysians | 7.0 /100 | #224 | Tragic $81,064 |
| Scotch-Irish | 6.6 /100 | #225 | Tragic $80,972 |
| Immigrants | Panama | 6.2 /100 | #226 | Tragic $80,873 |
| Guyanese | 5.7 /100 | #227 | Tragic $80,734 |
| Immigrants | Bangladesh | 5.7 /100 | #228 | Tragic $80,722 |
| Delaware | 5.0 /100 | #229 | Tragic $80,527 |