Pakistani vs Portuguese Median Household Income
COMPARE
Pakistani
Portuguese
Median Household Income
Median Household Income Comparison
Pakistanis
Portuguese
$89,638
MEDIAN HOUSEHOLD INCOME
94.8/ 100
METRIC RATING
122nd/ 347
METRIC RANK
$88,976
MEDIAN HOUSEHOLD INCOME
92.3/ 100
METRIC RATING
128th/ 347
METRIC RANK
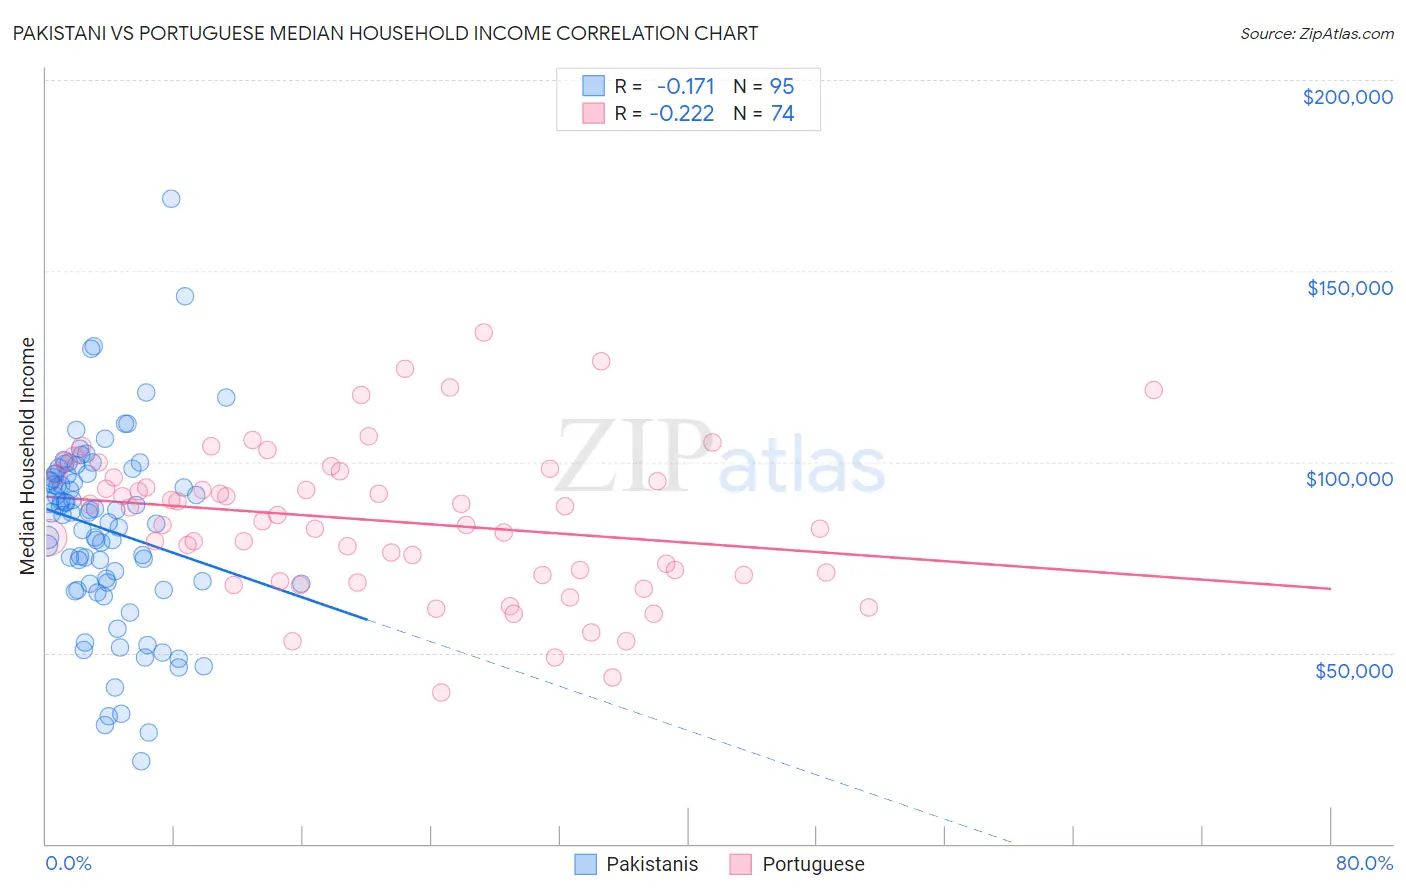
Pakistani vs Portuguese Median Household Income Correlation Chart
The statistical analysis conducted on geographies consisting of 335,154,769 people shows a poor negative correlation between the proportion of Pakistanis and median household income in the United States with a correlation coefficient (R) of -0.171 and weighted average of $89,638. Similarly, the statistical analysis conducted on geographies consisting of 449,847,647 people shows a weak negative correlation between the proportion of Portuguese and median household income in the United States with a correlation coefficient (R) of -0.222 and weighted average of $88,976, a difference of 0.74%.
Median Household Income Correlation Summary
| Measurement | Pakistani | Portuguese |
| Minimum | $21,500 | $39,715 |
| Maximum | $169,063 | $133,721 |
| Range | $147,563 | $94,006 |
| Mean | $82,388 | $84,548 |
| Median | $86,853 | $85,247 |
| Interquartile 25% (IQ1) | $68,125 | $70,338 |
| Interquartile 75% (IQ3) | $96,894 | $96,551 |
| Interquartile Range (IQR) | $28,769 | $26,213 |
| Standard Deviation (Sample) | $24,553 | $19,508 |
| Standard Deviation (Population) | $24,423 | $19,376 |
Demographics Similar to Pakistanis and Portuguese by Median Household Income
In terms of median household income, the demographic groups most similar to Pakistanis are Ethiopian ($89,640, a difference of 0.0%), Immigrants from North Macedonia ($89,741, a difference of 0.11%), Albanian ($89,744, a difference of 0.12%), Immigrants from Zimbabwe ($89,496, a difference of 0.16%), and Syrian ($89,830, a difference of 0.21%). Similarly, the demographic groups most similar to Portuguese are Immigrants from Peru ($89,010, a difference of 0.040%), Brazilian ($88,934, a difference of 0.050%), British ($88,914, a difference of 0.070%), Immigrants from Oceania ($89,100, a difference of 0.14%), and Immigrants from Syria ($88,792, a difference of 0.21%).
| Demographics | Rating | Rank | Median Household Income |
| Immigrants | Western Asia | 95.9 /100 | #115 | Exceptional $90,005 |
| Native Hawaiians | 95.7 /100 | #116 | Exceptional $89,919 |
| Taiwanese | 95.6 /100 | #117 | Exceptional $89,900 |
| Syrians | 95.4 /100 | #118 | Exceptional $89,830 |
| Albanians | 95.2 /100 | #119 | Exceptional $89,744 |
| Immigrants | North Macedonia | 95.2 /100 | #120 | Exceptional $89,741 |
| Ethiopians | 94.9 /100 | #121 | Exceptional $89,640 |
| Pakistanis | 94.8 /100 | #122 | Exceptional $89,638 |
| Immigrants | Zimbabwe | 94.4 /100 | #123 | Exceptional $89,496 |
| Immigrants | Jordan | 94.1 /100 | #124 | Exceptional $89,412 |
| Immigrants | Kuwait | 93.5 /100 | #125 | Exceptional $89,263 |
| Immigrants | Oceania | 92.9 /100 | #126 | Exceptional $89,100 |
| Immigrants | Peru | 92.5 /100 | #127 | Exceptional $89,010 |
| Portuguese | 92.3 /100 | #128 | Exceptional $88,976 |
| Brazilians | 92.1 /100 | #129 | Exceptional $88,934 |
| British | 92.0 /100 | #130 | Exceptional $88,914 |
| Immigrants | Syria | 91.4 /100 | #131 | Exceptional $88,792 |
| Europeans | 91.2 /100 | #132 | Exceptional $88,751 |
| Immigrants | Ethiopia | 90.9 /100 | #133 | Exceptional $88,687 |
| Swedes | 90.0 /100 | #134 | Exceptional $88,524 |
| Immigrants | Sierra Leone | 89.9 /100 | #135 | Excellent $88,498 |