Seminole vs Immigrants from Bulgaria Median Male Earnings
COMPARE
Seminole
Immigrants from Bulgaria
Median Male Earnings
Median Male Earnings Comparison
Seminole
Immigrants from Bulgaria
$46,783
MEDIAN MALE EARNINGS
0.1/ 100
METRIC RATING
302nd/ 347
METRIC RANK
$60,358
MEDIAN MALE EARNINGS
99.7/ 100
METRIC RATING
70th/ 347
METRIC RANK
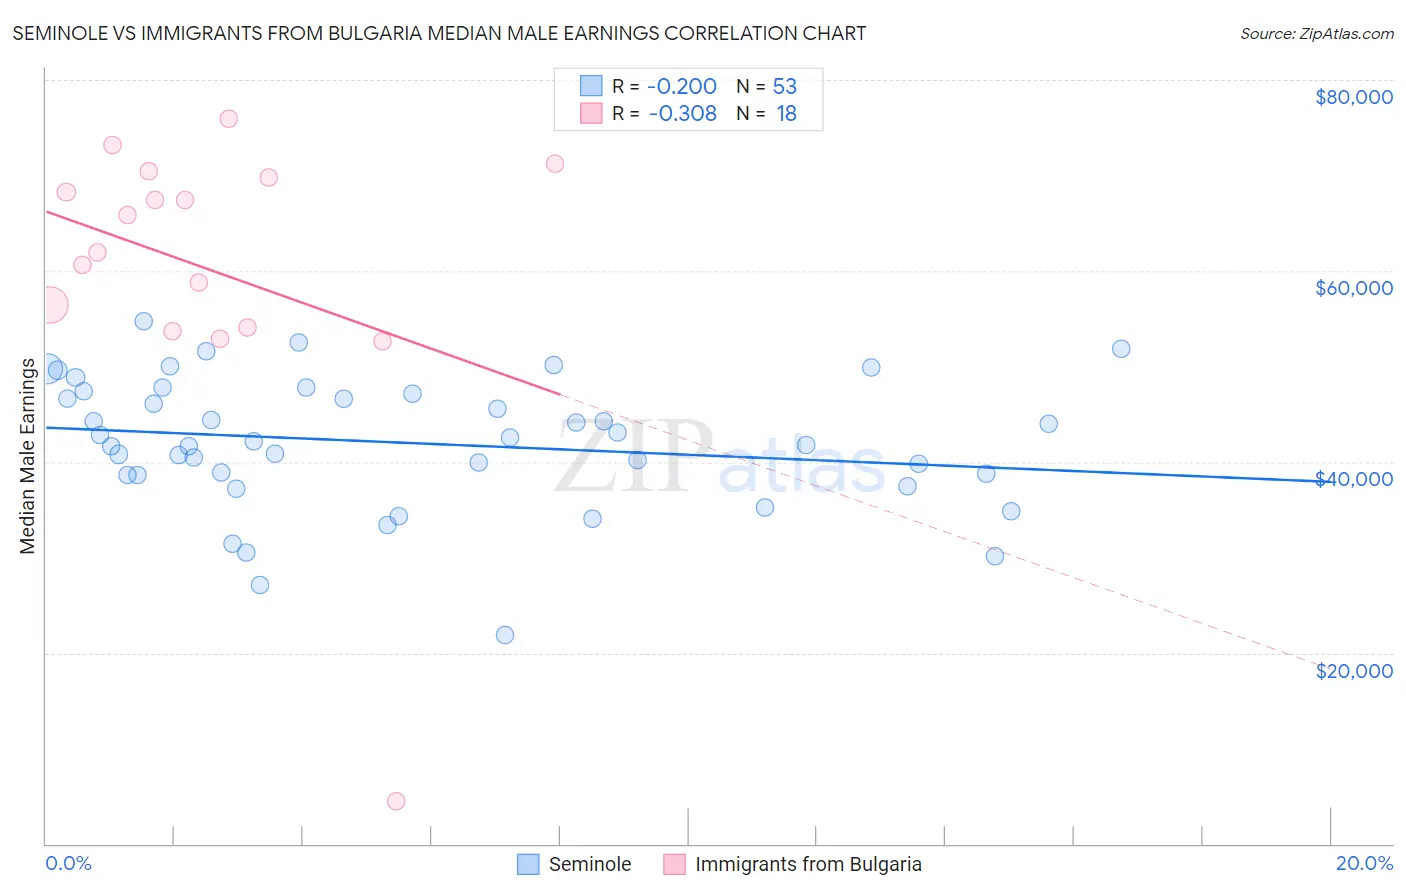
Seminole vs Immigrants from Bulgaria Median Male Earnings Correlation Chart
The statistical analysis conducted on geographies consisting of 118,283,332 people shows a poor negative correlation between the proportion of Seminole and median male earnings in the United States with a correlation coefficient (R) of -0.200 and weighted average of $46,783. Similarly, the statistical analysis conducted on geographies consisting of 172,534,572 people shows a mild negative correlation between the proportion of Immigrants from Bulgaria and median male earnings in the United States with a correlation coefficient (R) of -0.308 and weighted average of $60,358, a difference of 29.0%.
Median Male Earnings Correlation Summary
| Measurement | Seminole | Immigrants from Bulgaria |
| Minimum | $21,845 | $4,447 |
| Maximum | $54,701 | $75,897 |
| Range | $32,856 | $71,450 |
| Mean | $41,991 | $60,294 |
| Median | $42,165 | $63,912 |
| Interquartile 25% (IQ1) | $38,676 | $54,049 |
| Interquartile 75% (IQ3) | $47,251 | $69,736 |
| Interquartile Range (IQR) | $8,575 | $15,687 |
| Standard Deviation (Sample) | $6,861 | $15,823 |
| Standard Deviation (Population) | $6,796 | $15,377 |
Similar Demographics by Median Male Earnings
Demographics Similar to Seminole by Median Male Earnings
In terms of median male earnings, the demographic groups most similar to Seminole are Yaqui ($46,777, a difference of 0.010%), Bangladeshi ($46,744, a difference of 0.080%), Guatemalan ($46,736, a difference of 0.10%), Dutch West Indian ($46,656, a difference of 0.27%), and Immigrants from Dominican Republic ($46,655, a difference of 0.27%).
| Demographics | Rating | Rank | Median Male Earnings |
| Central American Indians | 0.1 /100 | #295 | Tragic $47,433 |
| Inupiat | 0.1 /100 | #296 | Tragic $47,281 |
| Dominicans | 0.1 /100 | #297 | Tragic $47,204 |
| Immigrants | Micronesia | 0.1 /100 | #298 | Tragic $47,177 |
| Immigrants | Zaire | 0.1 /100 | #299 | Tragic $47,070 |
| U.S. Virgin Islanders | 0.1 /100 | #300 | Tragic $47,066 |
| Immigrants | Latin America | 0.1 /100 | #301 | Tragic $46,941 |
| Seminole | 0.1 /100 | #302 | Tragic $46,783 |
| Yaqui | 0.1 /100 | #303 | Tragic $46,777 |
| Bangladeshis | 0.1 /100 | #304 | Tragic $46,744 |
| Guatemalans | 0.0 /100 | #305 | Tragic $46,736 |
| Dutch West Indians | 0.0 /100 | #306 | Tragic $46,656 |
| Immigrants | Dominican Republic | 0.0 /100 | #307 | Tragic $46,655 |
| Ottawa | 0.0 /100 | #308 | Tragic $46,611 |
| Creek | 0.0 /100 | #309 | Tragic $46,594 |
Demographics Similar to Immigrants from Bulgaria by Median Male Earnings
In terms of median male earnings, the demographic groups most similar to Immigrants from Bulgaria are Mongolian ($60,350, a difference of 0.010%), Immigrants from Western Europe ($60,334, a difference of 0.040%), Immigrants from Canada ($60,388, a difference of 0.050%), Immigrants from North America ($60,265, a difference of 0.16%), and Immigrants from Serbia ($60,600, a difference of 0.40%).
| Demographics | Rating | Rank | Median Male Earnings |
| Immigrants | Pakistan | 99.8 /100 | #63 | Exceptional $60,987 |
| Immigrants | Eastern Europe | 99.8 /100 | #64 | Exceptional $60,958 |
| Immigrants | Indonesia | 99.8 /100 | #65 | Exceptional $60,935 |
| Immigrants | Croatia | 99.8 /100 | #66 | Exceptional $60,914 |
| Immigrants | Spain | 99.8 /100 | #67 | Exceptional $60,750 |
| Immigrants | Serbia | 99.7 /100 | #68 | Exceptional $60,600 |
| Immigrants | Canada | 99.7 /100 | #69 | Exceptional $60,388 |
| Immigrants | Bulgaria | 99.7 /100 | #70 | Exceptional $60,358 |
| Mongolians | 99.7 /100 | #71 | Exceptional $60,350 |
| Immigrants | Western Europe | 99.7 /100 | #72 | Exceptional $60,334 |
| Immigrants | North America | 99.7 /100 | #73 | Exceptional $60,265 |
| Argentineans | 99.6 /100 | #74 | Exceptional $60,117 |
| Immigrants | Bolivia | 99.6 /100 | #75 | Exceptional $60,088 |
| Romanians | 99.6 /100 | #76 | Exceptional $60,063 |
| Paraguayans | 99.5 /100 | #77 | Exceptional $59,975 |