Norwegian vs Immigrants from Bulgaria Median Male Earnings
COMPARE
Norwegian
Immigrants from Bulgaria
Median Male Earnings
Median Male Earnings Comparison
Norwegians
Immigrants from Bulgaria
$55,965
MEDIAN MALE EARNINGS
80.9/ 100
METRIC RATING
145th/ 347
METRIC RANK
$60,358
MEDIAN MALE EARNINGS
99.7/ 100
METRIC RATING
70th/ 347
METRIC RANK
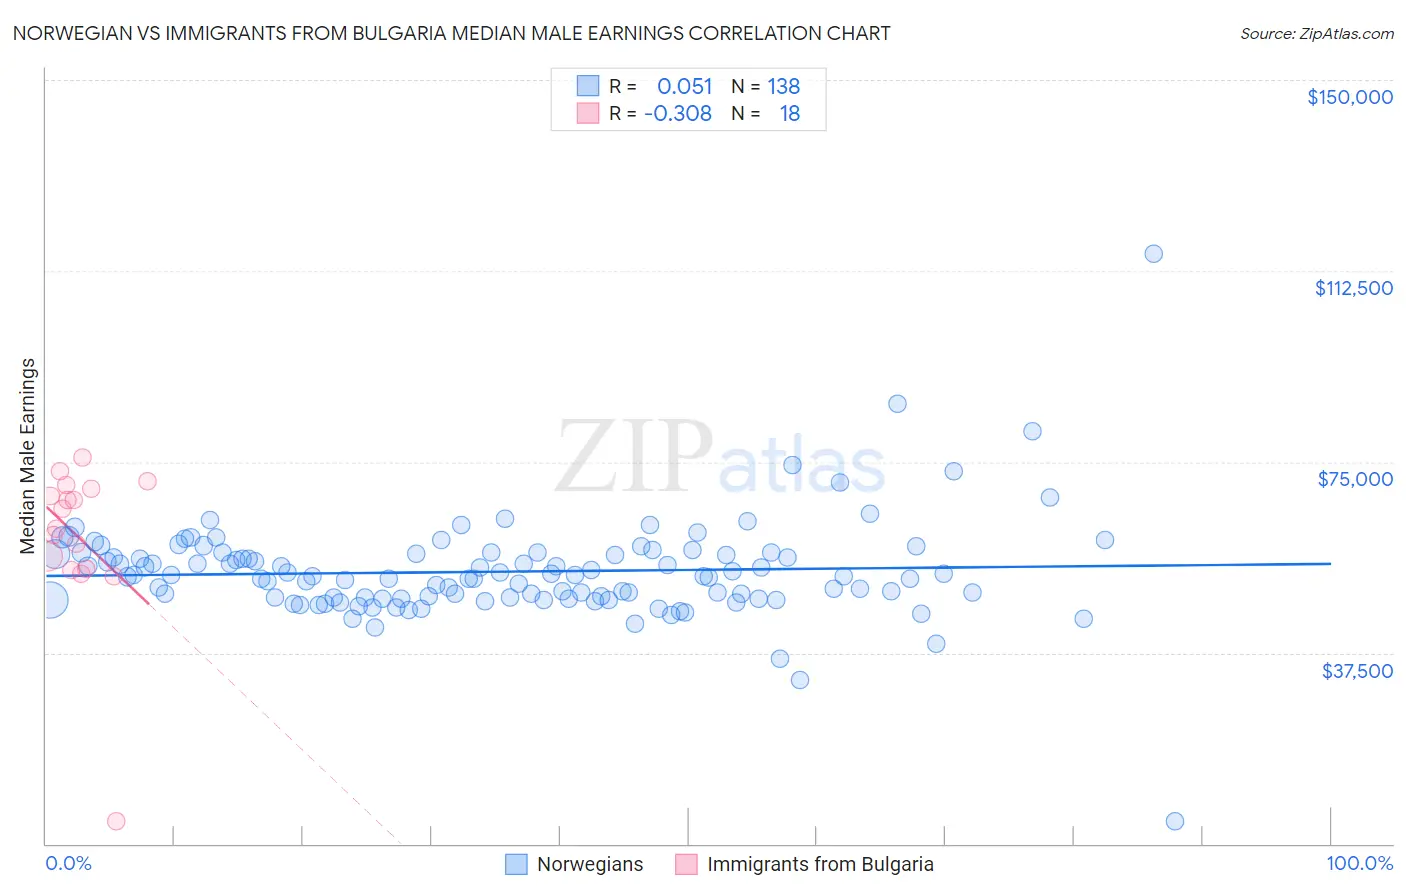
Norwegian vs Immigrants from Bulgaria Median Male Earnings Correlation Chart
The statistical analysis conducted on geographies consisting of 532,659,369 people shows a slight positive correlation between the proportion of Norwegians and median male earnings in the United States with a correlation coefficient (R) of 0.051 and weighted average of $55,965. Similarly, the statistical analysis conducted on geographies consisting of 172,534,572 people shows a mild negative correlation between the proportion of Immigrants from Bulgaria and median male earnings in the United States with a correlation coefficient (R) of -0.308 and weighted average of $60,358, a difference of 7.9%.
Median Male Earnings Correlation Summary
| Measurement | Norwegian | Immigrants from Bulgaria |
| Minimum | $4,318 | $4,447 |
| Maximum | $115,833 | $75,897 |
| Range | $111,515 | $71,450 |
| Mean | $53,449 | $60,294 |
| Median | $52,554 | $63,912 |
| Interquartile 25% (IQ1) | $48,297 | $54,049 |
| Interquartile 75% (IQ3) | $57,158 | $69,736 |
| Interquartile Range (IQR) | $8,861 | $15,687 |
| Standard Deviation (Sample) | $10,042 | $15,823 |
| Standard Deviation (Population) | $10,005 | $15,377 |
Similar Demographics by Median Male Earnings
Demographics Similar to Norwegians by Median Male Earnings
In terms of median male earnings, the demographic groups most similar to Norwegians are Immigrants from Chile ($55,954, a difference of 0.020%), Immigrants from Uganda ($56,064, a difference of 0.18%), Immigrants from Philippines ($55,809, a difference of 0.28%), Sri Lankan ($56,136, a difference of 0.31%), and Scottish ($55,793, a difference of 0.31%).
| Demographics | Rating | Rank | Median Male Earnings |
| Slovaks | 85.5 /100 | #138 | Excellent $56,306 |
| Zimbabweans | 85.5 /100 | #139 | Excellent $56,302 |
| Luxembourgers | 85.5 /100 | #140 | Excellent $56,300 |
| Danes | 84.8 /100 | #141 | Excellent $56,246 |
| Ethiopians | 84.8 /100 | #142 | Excellent $56,243 |
| Sri Lankans | 83.4 /100 | #143 | Excellent $56,136 |
| Immigrants | Uganda | 82.4 /100 | #144 | Excellent $56,064 |
| Norwegians | 80.9 /100 | #145 | Excellent $55,965 |
| Immigrants | Chile | 80.7 /100 | #146 | Excellent $55,954 |
| Immigrants | Philippines | 78.4 /100 | #147 | Good $55,809 |
| Scottish | 78.2 /100 | #148 | Good $55,793 |
| English | 77.4 /100 | #149 | Good $55,747 |
| Swiss | 77.1 /100 | #150 | Good $55,731 |
| Immigrants | Oceania | 76.8 /100 | #151 | Good $55,712 |
| Peruvians | 75.8 /100 | #152 | Good $55,659 |
Demographics Similar to Immigrants from Bulgaria by Median Male Earnings
In terms of median male earnings, the demographic groups most similar to Immigrants from Bulgaria are Mongolian ($60,350, a difference of 0.010%), Immigrants from Western Europe ($60,334, a difference of 0.040%), Immigrants from Canada ($60,388, a difference of 0.050%), Immigrants from North America ($60,265, a difference of 0.16%), and Immigrants from Serbia ($60,600, a difference of 0.40%).
| Demographics | Rating | Rank | Median Male Earnings |
| Immigrants | Pakistan | 99.8 /100 | #63 | Exceptional $60,987 |
| Immigrants | Eastern Europe | 99.8 /100 | #64 | Exceptional $60,958 |
| Immigrants | Indonesia | 99.8 /100 | #65 | Exceptional $60,935 |
| Immigrants | Croatia | 99.8 /100 | #66 | Exceptional $60,914 |
| Immigrants | Spain | 99.8 /100 | #67 | Exceptional $60,750 |
| Immigrants | Serbia | 99.7 /100 | #68 | Exceptional $60,600 |
| Immigrants | Canada | 99.7 /100 | #69 | Exceptional $60,388 |
| Immigrants | Bulgaria | 99.7 /100 | #70 | Exceptional $60,358 |
| Mongolians | 99.7 /100 | #71 | Exceptional $60,350 |
| Immigrants | Western Europe | 99.7 /100 | #72 | Exceptional $60,334 |
| Immigrants | North America | 99.7 /100 | #73 | Exceptional $60,265 |
| Argentineans | 99.6 /100 | #74 | Exceptional $60,117 |
| Immigrants | Bolivia | 99.6 /100 | #75 | Exceptional $60,088 |
| Romanians | 99.6 /100 | #76 | Exceptional $60,063 |
| Paraguayans | 99.5 /100 | #77 | Exceptional $59,975 |