Tongan vs Menominee Median Household Income
COMPARE
Tongan
Menominee
Median Household Income
Median Household Income Comparison
Tongans
Menominee
$93,076
MEDIAN HOUSEHOLD INCOME
99.4/ 100
METRIC RATING
80th/ 347
METRIC RANK
$68,423
MEDIAN HOUSEHOLD INCOME
0.0/ 100
METRIC RATING
328th/ 347
METRIC RANK
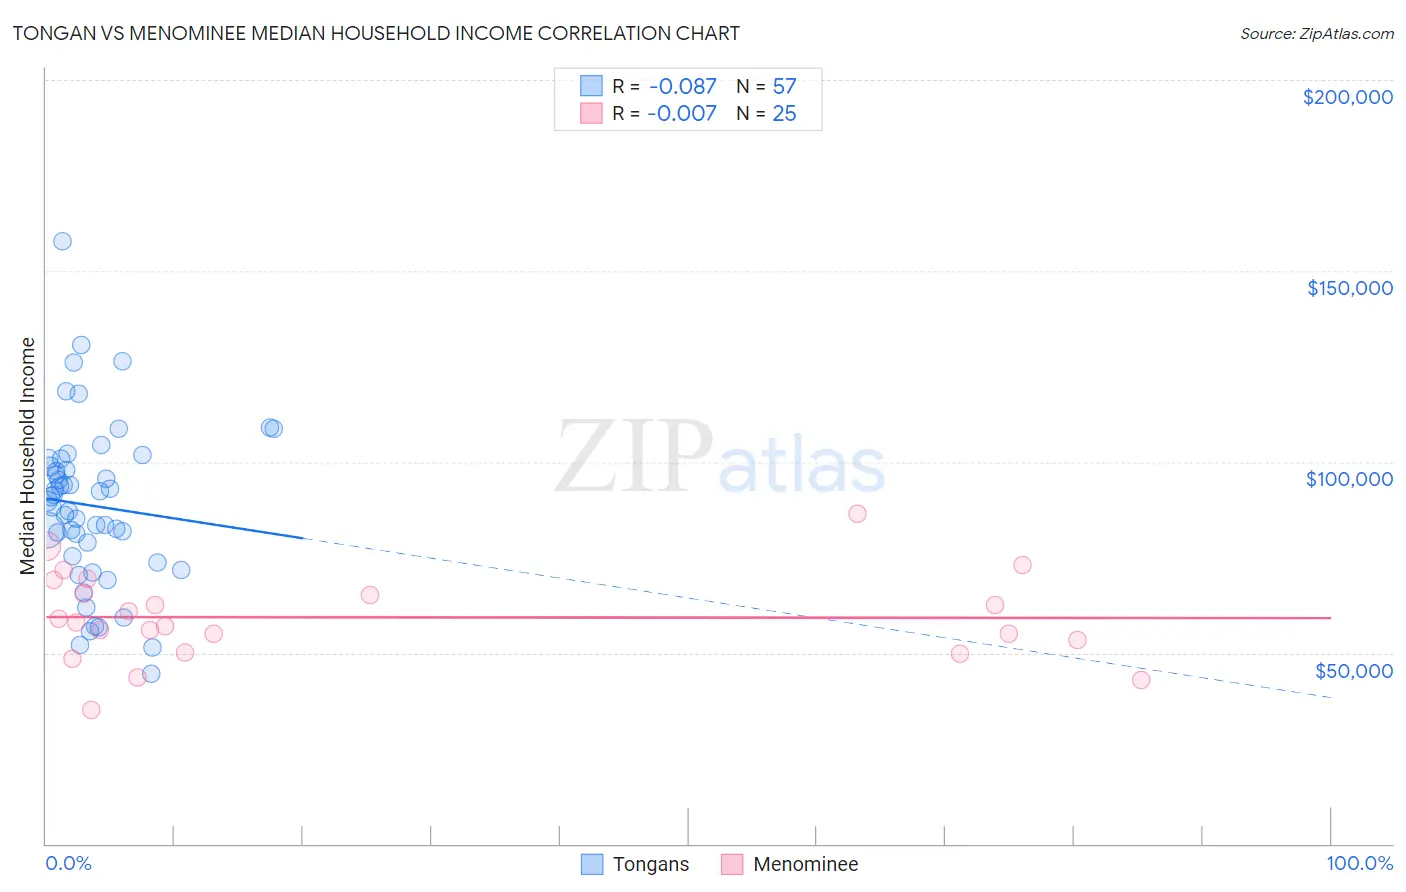
Tongan vs Menominee Median Household Income Correlation Chart
The statistical analysis conducted on geographies consisting of 102,857,692 people shows a slight negative correlation between the proportion of Tongans and median household income in the United States with a correlation coefficient (R) of -0.087 and weighted average of $93,076. Similarly, the statistical analysis conducted on geographies consisting of 45,776,591 people shows no correlation between the proportion of Menominee and median household income in the United States with a correlation coefficient (R) of -0.007 and weighted average of $68,423, a difference of 36.0%.
Median Household Income Correlation Summary
| Measurement | Tongan | Menominee |
| Minimum | $44,375 | $35,112 |
| Maximum | $157,875 | $86,563 |
| Range | $113,500 | $51,451 |
| Mean | $88,526 | $59,292 |
| Median | $89,840 | $57,897 |
| Interquartile 25% (IQ1) | $74,550 | $51,640 |
| Interquartile 75% (IQ3) | $99,865 | $67,237 |
| Interquartile Range (IQR) | $25,315 | $15,596 |
| Standard Deviation (Sample) | $21,499 | $11,591 |
| Standard Deviation (Population) | $21,310 | $11,357 |
Similar Demographics by Median Household Income
Demographics Similar to Tongans by Median Household Income
In terms of median household income, the demographic groups most similar to Tongans are Sri Lankan ($93,093, a difference of 0.020%), Immigrants from Eastern Europe ($93,051, a difference of 0.030%), Immigrants from Bulgaria ($93,148, a difference of 0.080%), Immigrants from Afghanistan ($93,375, a difference of 0.32%), and South African ($93,379, a difference of 0.33%).
| Demographics | Rating | Rank | Median Household Income |
| Immigrants | Egypt | 99.6 /100 | #73 | Exceptional $93,700 |
| Immigrants | Latvia | 99.6 /100 | #74 | Exceptional $93,602 |
| Immigrants | Italy | 99.5 /100 | #75 | Exceptional $93,465 |
| South Africans | 99.5 /100 | #76 | Exceptional $93,379 |
| Immigrants | Afghanistan | 99.5 /100 | #77 | Exceptional $93,375 |
| Immigrants | Bulgaria | 99.4 /100 | #78 | Exceptional $93,148 |
| Sri Lankans | 99.4 /100 | #79 | Exceptional $93,093 |
| Tongans | 99.4 /100 | #80 | Exceptional $93,076 |
| Immigrants | Eastern Europe | 99.4 /100 | #81 | Exceptional $93,051 |
| Immigrants | Spain | 99.3 /100 | #82 | Exceptional $92,732 |
| Italians | 99.1 /100 | #83 | Exceptional $92,475 |
| Immigrants | Argentina | 99.1 /100 | #84 | Exceptional $92,417 |
| Immigrants | Croatia | 99.0 /100 | #85 | Exceptional $92,225 |
| Immigrants | England | 98.9 /100 | #86 | Exceptional $92,098 |
| Immigrants | Hungary | 98.9 /100 | #87 | Exceptional $92,094 |
Demographics Similar to Menominee by Median Household Income
In terms of median household income, the demographic groups most similar to Menominee are Dutch West Indian ($68,412, a difference of 0.020%), Immigrants from Cuba ($68,461, a difference of 0.060%), Yuman ($68,743, a difference of 0.47%), Arapaho ($67,965, a difference of 0.67%), and Native/Alaskan ($67,879, a difference of 0.80%).
| Demographics | Rating | Rank | Median Household Income |
| Chickasaw | 0.0 /100 | #321 | Tragic $70,005 |
| Choctaw | 0.0 /100 | #322 | Tragic $69,947 |
| Bahamians | 0.0 /100 | #323 | Tragic $69,726 |
| Yup'ik | 0.0 /100 | #324 | Tragic $69,695 |
| Seminole | 0.0 /100 | #325 | Tragic $69,420 |
| Yuman | 0.0 /100 | #326 | Tragic $68,743 |
| Immigrants | Cuba | 0.0 /100 | #327 | Tragic $68,461 |
| Menominee | 0.0 /100 | #328 | Tragic $68,423 |
| Dutch West Indians | 0.0 /100 | #329 | Tragic $68,412 |
| Arapaho | 0.0 /100 | #330 | Tragic $67,965 |
| Natives/Alaskans | 0.0 /100 | #331 | Tragic $67,879 |
| Sioux | 0.0 /100 | #332 | Tragic $67,792 |
| Creek | 0.0 /100 | #333 | Tragic $67,715 |
| Blacks/African Americans | 0.0 /100 | #334 | Tragic $67,573 |
| Cheyenne | 0.0 /100 | #335 | Tragic $66,974 |