Ottawa vs Pueblo Doctorate Degree
COMPARE
Ottawa
Pueblo
Doctorate Degree
Doctorate Degree Comparison
Ottawa
Pueblo
1.6%
DOCTORATE DEGREE
2.2/ 100
METRIC RATING
242nd/ 347
METRIC RANK
1.7%
DOCTORATE DEGREE
14.2/ 100
METRIC RATING
214th/ 347
METRIC RANK
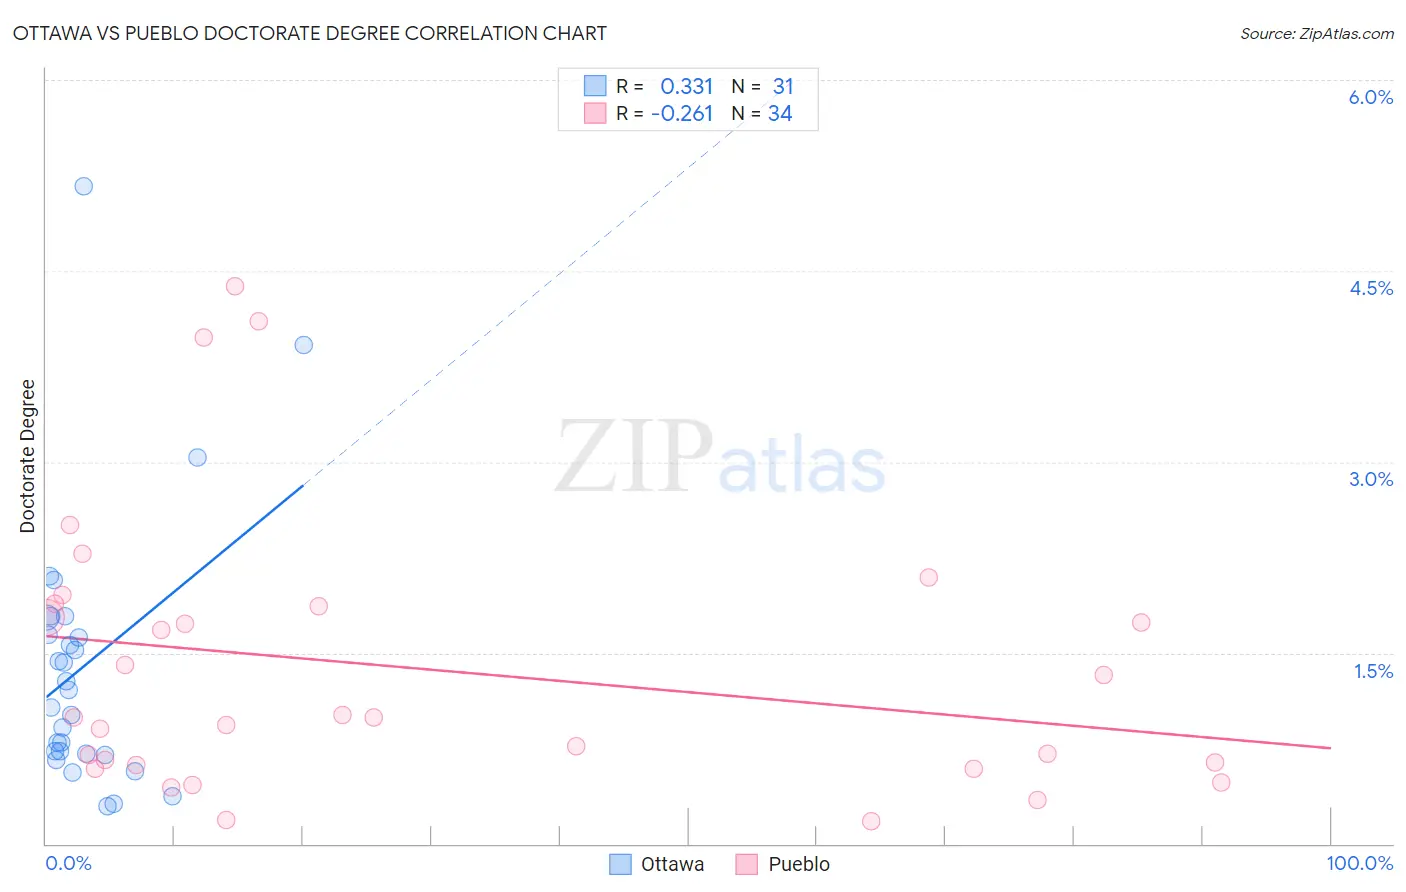
Ottawa vs Pueblo Doctorate Degree Correlation Chart
The statistical analysis conducted on geographies consisting of 49,607,860 people shows a mild positive correlation between the proportion of Ottawa and percentage of population with at least doctorate degree education in the United States with a correlation coefficient (R) of 0.331 and weighted average of 1.6%. Similarly, the statistical analysis conducted on geographies consisting of 119,278,004 people shows a weak negative correlation between the proportion of Pueblo and percentage of population with at least doctorate degree education in the United States with a correlation coefficient (R) of -0.261 and weighted average of 1.7%, a difference of 8.5%.
Doctorate Degree Correlation Summary
| Measurement | Ottawa | Pueblo |
| Minimum | 0.29% | 0.18% |
| Maximum | 5.2% | 4.4% |
| Range | 4.9% | 4.2% |
| Mean | 1.4% | 1.4% |
| Median | 1.2% | 0.99% |
| Interquartile 25% (IQ1) | 0.70% | 0.62% |
| Interquartile 75% (IQ3) | 1.8% | 1.9% |
| Interquartile Range (IQR) | 1.1% | 1.3% |
| Standard Deviation (Sample) | 1.1% | 1.1% |
| Standard Deviation (Population) | 1.0% | 1.1% |
Similar Demographics by Doctorate Degree
Demographics Similar to Ottawa by Doctorate Degree
In terms of doctorate degree, the demographic groups most similar to Ottawa are Native Hawaiian (1.6%, a difference of 0.13%), Cheyenne (1.6%, a difference of 0.21%), French American Indian (1.6%, a difference of 0.32%), Immigrants from Panama (1.6%, a difference of 0.40%), and West Indian (1.6%, a difference of 0.59%).
| Demographics | Rating | Rank | Doctorate Degree |
| Cree | 3.0 /100 | #235 | Tragic 1.6% |
| Indonesians | 2.8 /100 | #236 | Tragic 1.6% |
| Iroquois | 2.7 /100 | #237 | Tragic 1.6% |
| Immigrants | Congo | 2.6 /100 | #238 | Tragic 1.6% |
| West Indians | 2.5 /100 | #239 | Tragic 1.6% |
| Immigrants | Panama | 2.4 /100 | #240 | Tragic 1.6% |
| Cheyenne | 2.3 /100 | #241 | Tragic 1.6% |
| Ottawa | 2.2 /100 | #242 | Tragic 1.6% |
| Native Hawaiians | 2.1 /100 | #243 | Tragic 1.6% |
| French American Indians | 2.0 /100 | #244 | Tragic 1.6% |
| Delaware | 1.9 /100 | #245 | Tragic 1.6% |
| Hmong | 1.8 /100 | #246 | Tragic 1.6% |
| Comanche | 1.8 /100 | #247 | Tragic 1.6% |
| Africans | 1.8 /100 | #248 | Tragic 1.6% |
| Potawatomi | 1.6 /100 | #249 | Tragic 1.6% |
Demographics Similar to Pueblo by Doctorate Degree
In terms of doctorate degree, the demographic groups most similar to Pueblo are Korean (1.7%, a difference of 0.010%), Alaskan Athabascan (1.7%, a difference of 0.14%), Immigrants from South Eastern Asia (1.7%, a difference of 0.15%), Immigrants from Burma/Myanmar (1.7%, a difference of 0.24%), and Immigrants from Armenia (1.7%, a difference of 0.28%).
| Demographics | Rating | Rank | Doctorate Degree |
| Yugoslavians | 17.1 /100 | #207 | Poor 1.7% |
| Colombians | 16.1 /100 | #208 | Poor 1.7% |
| Immigrants | Western Africa | 15.4 /100 | #209 | Poor 1.7% |
| Tongans | 15.1 /100 | #210 | Poor 1.7% |
| Immigrants | Armenia | 15.1 /100 | #211 | Poor 1.7% |
| Immigrants | South Eastern Asia | 14.7 /100 | #212 | Poor 1.7% |
| Koreans | 14.2 /100 | #213 | Poor 1.7% |
| Pueblo | 14.2 /100 | #214 | Poor 1.7% |
| Alaskan Athabascans | 13.8 /100 | #215 | Poor 1.7% |
| Immigrants | Burma/Myanmar | 13.5 /100 | #216 | Poor 1.7% |
| Spanish Americans | 12.9 /100 | #217 | Poor 1.7% |
| Tlingit-Haida | 11.9 /100 | #218 | Poor 1.7% |
| Immigrants | Iraq | 10.7 /100 | #219 | Poor 1.7% |
| Immigrants | Uruguay | 9.2 /100 | #220 | Tragic 1.7% |
| Immigrants | Nonimmigrants | 8.8 /100 | #221 | Tragic 1.7% |