Immigrants from South Eastern Asia vs Pueblo Median Earnings
COMPARE
Immigrants from South Eastern Asia
Pueblo
Median Earnings
Median Earnings Comparison
Immigrants from South Eastern Asia
Pueblo
$47,671
MEDIAN EARNINGS
85.0/ 100
METRIC RATING
147th/ 347
METRIC RANK
$36,859
MEDIAN EARNINGS
0.0/ 100
METRIC RATING
343rd/ 347
METRIC RANK
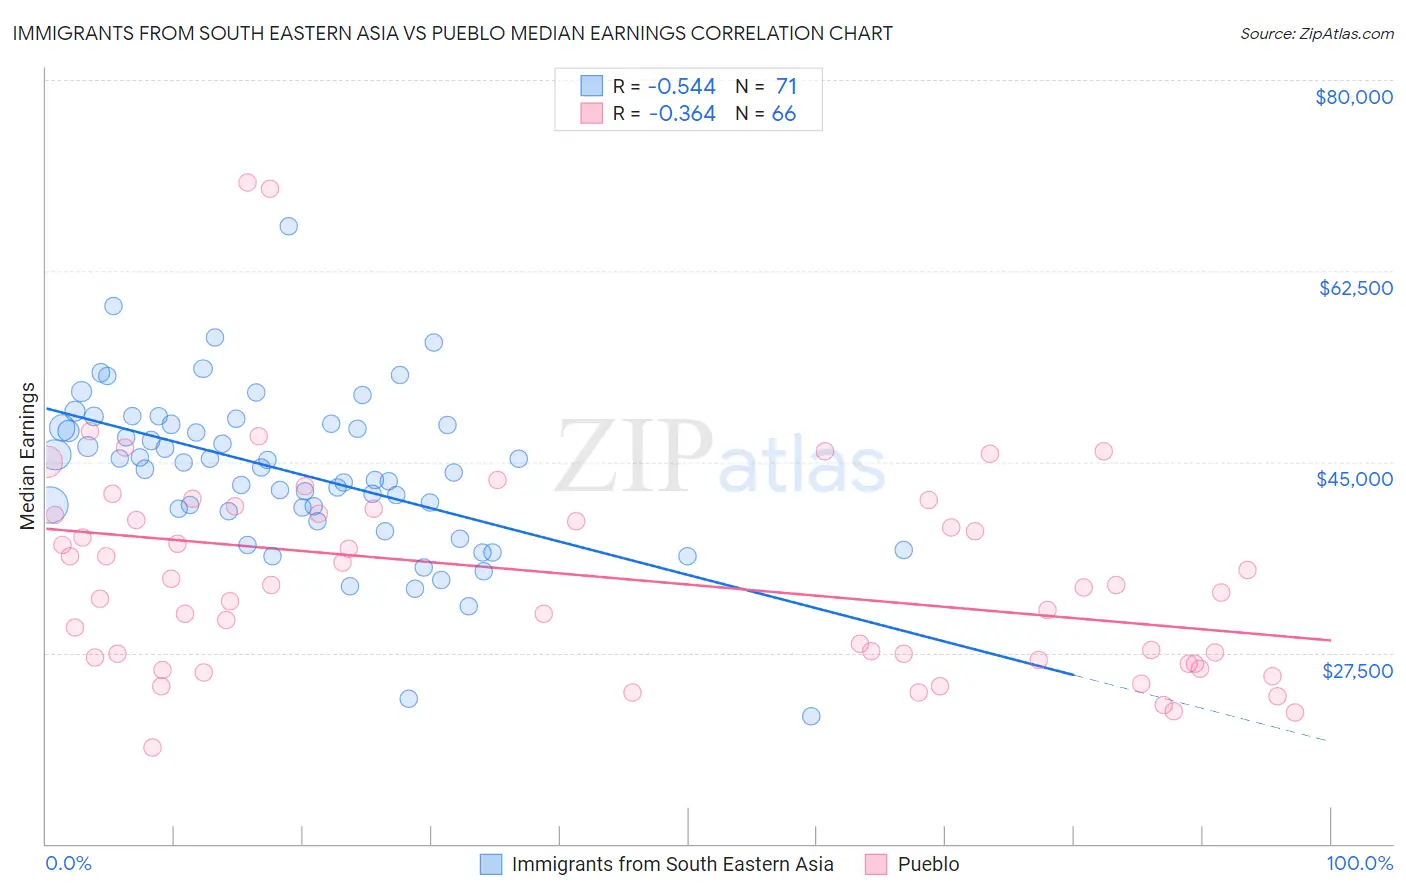
Immigrants from South Eastern Asia vs Pueblo Median Earnings Correlation Chart
The statistical analysis conducted on geographies consisting of 512,554,349 people shows a substantial negative correlation between the proportion of Immigrants from South Eastern Asia and median earnings in the United States with a correlation coefficient (R) of -0.544 and weighted average of $47,671. Similarly, the statistical analysis conducted on geographies consisting of 120,073,661 people shows a mild negative correlation between the proportion of Pueblo and median earnings in the United States with a correlation coefficient (R) of -0.364 and weighted average of $36,859, a difference of 29.3%.
Median Earnings Correlation Summary
| Measurement | Immigrants from South Eastern Asia | Pueblo |
| Minimum | $21,667 | $18,846 |
| Maximum | $66,617 | $70,625 |
| Range | $44,950 | $51,779 |
| Mean | $44,037 | $34,570 |
| Median | $44,467 | $33,598 |
| Interquartile 25% (IQ1) | $40,525 | $26,791 |
| Interquartile 75% (IQ3) | $48,439 | $40,227 |
| Interquartile Range (IQR) | $7,914 | $13,436 |
| Standard Deviation (Sample) | $7,447 | $9,914 |
| Standard Deviation (Population) | $7,395 | $9,839 |
Similar Demographics by Median Earnings
Demographics Similar to Immigrants from South Eastern Asia by Median Earnings
In terms of median earnings, the demographic groups most similar to Immigrants from South Eastern Asia are Immigrants from Eritrea ($47,657, a difference of 0.030%), Immigrants from Chile ($47,697, a difference of 0.060%), Luxembourger ($47,640, a difference of 0.060%), Immigrants from Saudi Arabia ($47,704, a difference of 0.070%), and Peruvian ($47,628, a difference of 0.090%).
| Demographics | Rating | Rank | Median Earnings |
| Taiwanese | 88.7 /100 | #140 | Excellent $47,902 |
| Immigrants | Sierra Leone | 88.3 /100 | #141 | Excellent $47,875 |
| Ugandans | 88.0 /100 | #142 | Excellent $47,854 |
| Swedes | 88.0 /100 | #143 | Excellent $47,851 |
| Hungarians | 87.1 /100 | #144 | Excellent $47,795 |
| Immigrants | Saudi Arabia | 85.6 /100 | #145 | Excellent $47,704 |
| Immigrants | Chile | 85.5 /100 | #146 | Excellent $47,697 |
| Immigrants | South Eastern Asia | 85.0 /100 | #147 | Excellent $47,671 |
| Immigrants | Eritrea | 84.8 /100 | #148 | Excellent $47,657 |
| Luxembourgers | 84.5 /100 | #149 | Excellent $47,640 |
| Peruvians | 84.2 /100 | #150 | Excellent $47,628 |
| Immigrants | Oceania | 84.1 /100 | #151 | Excellent $47,617 |
| Immigrants | Germany | 83.1 /100 | #152 | Excellent $47,566 |
| Slavs | 81.1 /100 | #153 | Excellent $47,470 |
| Immigrants | Portugal | 77.3 /100 | #154 | Good $47,304 |
Demographics Similar to Pueblo by Median Earnings
In terms of median earnings, the demographic groups most similar to Pueblo are Hopi ($36,871, a difference of 0.030%), Lumbee ($36,876, a difference of 0.050%), Navajo ($36,999, a difference of 0.38%), Arapaho ($36,586, a difference of 0.75%), and Tohono O'odham ($36,349, a difference of 1.4%).
| Demographics | Rating | Rank | Median Earnings |
| Houma | 0.0 /100 | #333 | Tragic $38,949 |
| Spanish American Indians | 0.0 /100 | #334 | Tragic $38,907 |
| Natives/Alaskans | 0.0 /100 | #335 | Tragic $38,896 |
| Crow | 0.0 /100 | #336 | Tragic $38,707 |
| Immigrants | Cuba | 0.0 /100 | #337 | Tragic $38,426 |
| Pima | 0.0 /100 | #338 | Tragic $38,285 |
| Menominee | 0.0 /100 | #339 | Tragic $37,884 |
| Navajo | 0.0 /100 | #340 | Tragic $36,999 |
| Lumbee | 0.0 /100 | #341 | Tragic $36,876 |
| Hopi | 0.0 /100 | #342 | Tragic $36,871 |
| Pueblo | 0.0 /100 | #343 | Tragic $36,859 |
| Arapaho | 0.0 /100 | #344 | Tragic $36,586 |
| Tohono O'odham | 0.0 /100 | #345 | Tragic $36,349 |
| Yup'ik | 0.0 /100 | #346 | Tragic $35,942 |
| Puerto Ricans | 0.0 /100 | #347 | Tragic $35,560 |