Ottawa vs Kiowa Median Male Earnings
COMPARE
Ottawa
Kiowa
Median Male Earnings
Median Male Earnings Comparison
Ottawa
Kiowa
$46,611
MEDIAN MALE EARNINGS
0.0/ 100
METRIC RATING
308th/ 347
METRIC RANK
$45,094
MEDIAN MALE EARNINGS
0.0/ 100
METRIC RATING
328th/ 347
METRIC RANK
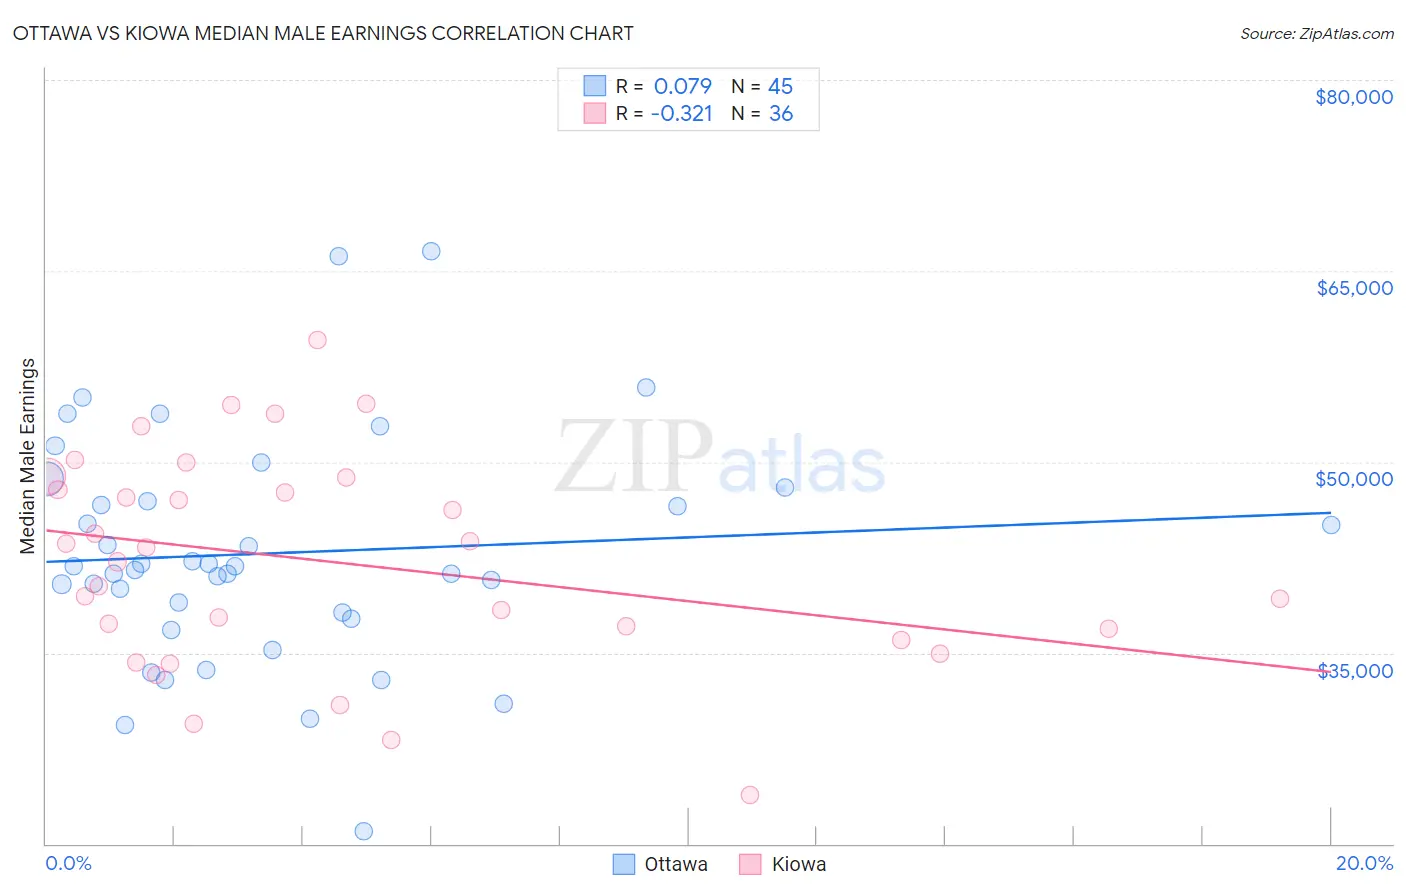
Ottawa vs Kiowa Median Male Earnings Correlation Chart
The statistical analysis conducted on geographies consisting of 49,954,818 people shows a slight positive correlation between the proportion of Ottawa and median male earnings in the United States with a correlation coefficient (R) of 0.079 and weighted average of $46,611. Similarly, the statistical analysis conducted on geographies consisting of 56,097,810 people shows a mild negative correlation between the proportion of Kiowa and median male earnings in the United States with a correlation coefficient (R) of -0.321 and weighted average of $45,094, a difference of 3.4%.
Median Male Earnings Correlation Summary
| Measurement | Ottawa | Kiowa |
| Minimum | $20,938 | $23,854 |
| Maximum | $66,563 | $59,583 |
| Range | $45,625 | $35,729 |
| Mean | $42,823 | $42,136 |
| Median | $41,768 | $42,718 |
| Interquartile 25% (IQ1) | $37,908 | $36,490 |
| Interquartile 75% (IQ3) | $47,441 | $48,295 |
| Interquartile Range (IQR) | $9,533 | $11,805 |
| Standard Deviation (Sample) | $8,970 | $8,380 |
| Standard Deviation (Population) | $8,870 | $8,263 |
Demographics Similar to Ottawa and Kiowa by Median Male Earnings
In terms of median male earnings, the demographic groups most similar to Ottawa are Creek ($46,594, a difference of 0.040%), Cuban ($46,580, a difference of 0.070%), Apache ($46,429, a difference of 0.39%), Hispanic or Latino ($46,419, a difference of 0.41%), and Honduran ($46,374, a difference of 0.51%). Similarly, the demographic groups most similar to Kiowa are Immigrants from Bahamas ($45,176, a difference of 0.18%), Immigrants from Haiti ($45,266, a difference of 0.38%), Yuman ($45,446, a difference of 0.78%), Black/African American ($45,523, a difference of 0.95%), and Immigrants from Central America ($45,538, a difference of 0.99%).
| Demographics | Rating | Rank | Median Male Earnings |
| Ottawa | 0.0 /100 | #308 | Tragic $46,611 |
| Creek | 0.0 /100 | #309 | Tragic $46,594 |
| Cubans | 0.0 /100 | #310 | Tragic $46,580 |
| Apache | 0.0 /100 | #311 | Tragic $46,429 |
| Hispanics or Latinos | 0.0 /100 | #312 | Tragic $46,419 |
| Hondurans | 0.0 /100 | #313 | Tragic $46,374 |
| Chippewa | 0.0 /100 | #314 | Tragic $46,368 |
| Immigrants | Guatemala | 0.0 /100 | #315 | Tragic $46,244 |
| Immigrants | Caribbean | 0.0 /100 | #316 | Tragic $46,193 |
| Mexicans | 0.0 /100 | #317 | Tragic $46,147 |
| Cheyenne | 0.0 /100 | #318 | Tragic $46,062 |
| Haitians | 0.0 /100 | #319 | Tragic $45,903 |
| Immigrants | Honduras | 0.0 /100 | #320 | Tragic $45,787 |
| Fijians | 0.0 /100 | #321 | Tragic $45,607 |
| Sioux | 0.0 /100 | #322 | Tragic $45,566 |
| Immigrants | Central America | 0.0 /100 | #323 | Tragic $45,538 |
| Blacks/African Americans | 0.0 /100 | #324 | Tragic $45,523 |
| Yuman | 0.0 /100 | #325 | Tragic $45,446 |
| Immigrants | Haiti | 0.0 /100 | #326 | Tragic $45,266 |
| Immigrants | Bahamas | 0.0 /100 | #327 | Tragic $45,176 |
| Kiowa | 0.0 /100 | #328 | Tragic $45,094 |