Ottawa vs Jordanian Median Household Income
COMPARE
Ottawa
Jordanian
Median Household Income
Median Household Income Comparison
Ottawa
Jordanians
$70,984
MEDIAN HOUSEHOLD INCOME
0.0/ 100
METRIC RATING
315th/ 347
METRIC RANK
$91,794
MEDIAN HOUSEHOLD INCOME
98.7/ 100
METRIC RATING
96th/ 347
METRIC RANK
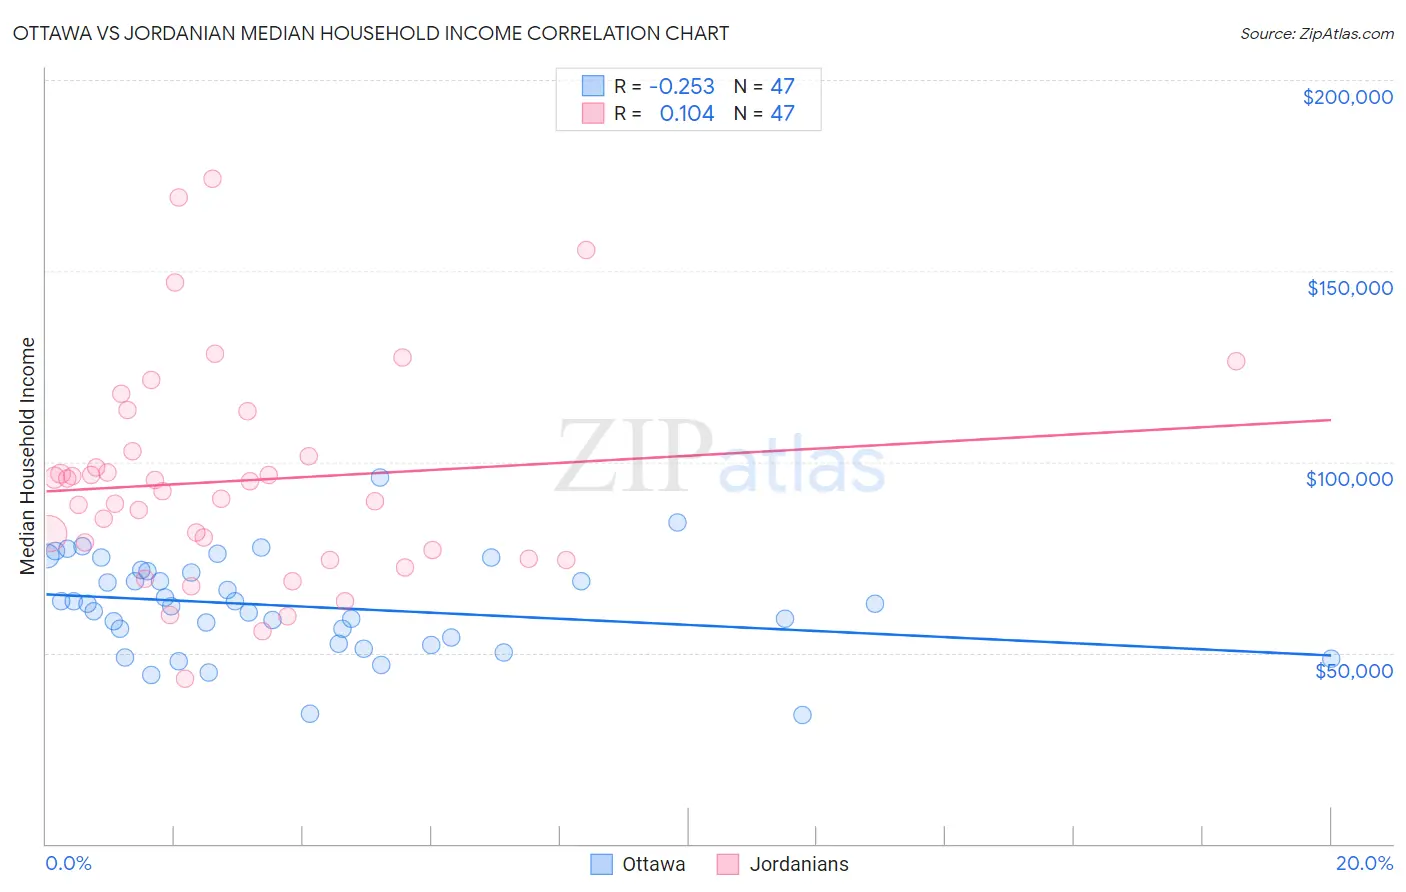
Ottawa vs Jordanian Median Household Income Correlation Chart
The statistical analysis conducted on geographies consisting of 49,944,469 people shows a weak negative correlation between the proportion of Ottawa and median household income in the United States with a correlation coefficient (R) of -0.253 and weighted average of $70,984. Similarly, the statistical analysis conducted on geographies consisting of 166,374,087 people shows a poor positive correlation between the proportion of Jordanians and median household income in the United States with a correlation coefficient (R) of 0.104 and weighted average of $91,794, a difference of 29.3%.
Median Household Income Correlation Summary
| Measurement | Ottawa | Jordanian |
| Minimum | $33,750 | $43,214 |
| Maximum | $95,750 | $174,260 |
| Range | $62,000 | $131,046 |
| Mean | $62,197 | $95,049 |
| Median | $62,810 | $92,429 |
| Interquartile 25% (IQ1) | $52,443 | $74,643 |
| Interquartile 75% (IQ3) | $71,315 | $102,895 |
| Interquartile Range (IQR) | $18,872 | $28,252 |
| Standard Deviation (Sample) | $12,658 | $28,123 |
| Standard Deviation (Population) | $12,523 | $27,822 |
Similar Demographics by Median Household Income
Demographics Similar to Ottawa by Median Household Income
In terms of median household income, the demographic groups most similar to Ottawa are Apache ($70,927, a difference of 0.080%), Dominican ($71,302, a difference of 0.45%), Immigrants from Bahamas ($71,349, a difference of 0.51%), Cajun ($70,605, a difference of 0.54%), and Chippewa ($70,539, a difference of 0.63%).
| Demographics | Rating | Rank | Median Household Income |
| Yakama | 0.0 /100 | #308 | Tragic $72,225 |
| Immigrants | Caribbean | 0.0 /100 | #309 | Tragic $71,860 |
| U.S. Virgin Islanders | 0.0 /100 | #310 | Tragic $71,853 |
| Immigrants | Zaire | 0.0 /100 | #311 | Tragic $71,801 |
| Immigrants | Honduras | 0.0 /100 | #312 | Tragic $71,452 |
| Immigrants | Bahamas | 0.0 /100 | #313 | Tragic $71,349 |
| Dominicans | 0.0 /100 | #314 | Tragic $71,302 |
| Ottawa | 0.0 /100 | #315 | Tragic $70,984 |
| Apache | 0.0 /100 | #316 | Tragic $70,927 |
| Cajuns | 0.0 /100 | #317 | Tragic $70,605 |
| Chippewa | 0.0 /100 | #318 | Tragic $70,539 |
| Immigrants | Dominican Republic | 0.0 /100 | #319 | Tragic $70,208 |
| Colville | 0.0 /100 | #320 | Tragic $70,094 |
| Chickasaw | 0.0 /100 | #321 | Tragic $70,005 |
| Choctaw | 0.0 /100 | #322 | Tragic $69,947 |
Demographics Similar to Jordanians by Median Household Income
In terms of median household income, the demographic groups most similar to Jordanians are Armenian ($91,807, a difference of 0.010%), Immigrants from North America ($91,860, a difference of 0.070%), Immigrants from Serbia ($91,730, a difference of 0.070%), Immigrants from Lebanon ($91,887, a difference of 0.10%), and Immigrants from Western Europe ($91,936, a difference of 0.15%).
| Demographics | Rating | Rank | Median Household Income |
| Romanians | 98.8 /100 | #89 | Exceptional $91,994 |
| Assyrians/Chaldeans/Syriacs | 98.8 /100 | #90 | Exceptional $91,991 |
| Immigrants | Vietnam | 98.8 /100 | #91 | Exceptional $91,987 |
| Immigrants | Western Europe | 98.8 /100 | #92 | Exceptional $91,936 |
| Immigrants | Lebanon | 98.7 /100 | #93 | Exceptional $91,887 |
| Immigrants | North America | 98.7 /100 | #94 | Exceptional $91,860 |
| Armenians | 98.7 /100 | #95 | Exceptional $91,807 |
| Jordanians | 98.7 /100 | #96 | Exceptional $91,794 |
| Immigrants | Serbia | 98.6 /100 | #97 | Exceptional $91,730 |
| Immigrants | Southern Europe | 98.5 /100 | #98 | Exceptional $91,605 |
| Immigrants | South Eastern Asia | 98.4 /100 | #99 | Exceptional $91,541 |
| Ukrainians | 98.3 /100 | #100 | Exceptional $91,456 |
| Immigrants | Moldova | 98.3 /100 | #101 | Exceptional $91,446 |
| Austrians | 98.2 /100 | #102 | Exceptional $91,339 |
| Immigrants | Ukraine | 98.0 /100 | #103 | Exceptional $91,124 |