Ottawa vs Okinawan Median Household Income
COMPARE
Ottawa
Okinawan
Median Household Income
Median Household Income Comparison
Ottawa
Okinawans
$70,984
MEDIAN HOUSEHOLD INCOME
0.0/ 100
METRIC RATING
315th/ 347
METRIC RANK
$106,624
MEDIAN HOUSEHOLD INCOME
100.0/ 100
METRIC RATING
9th/ 347
METRIC RANK
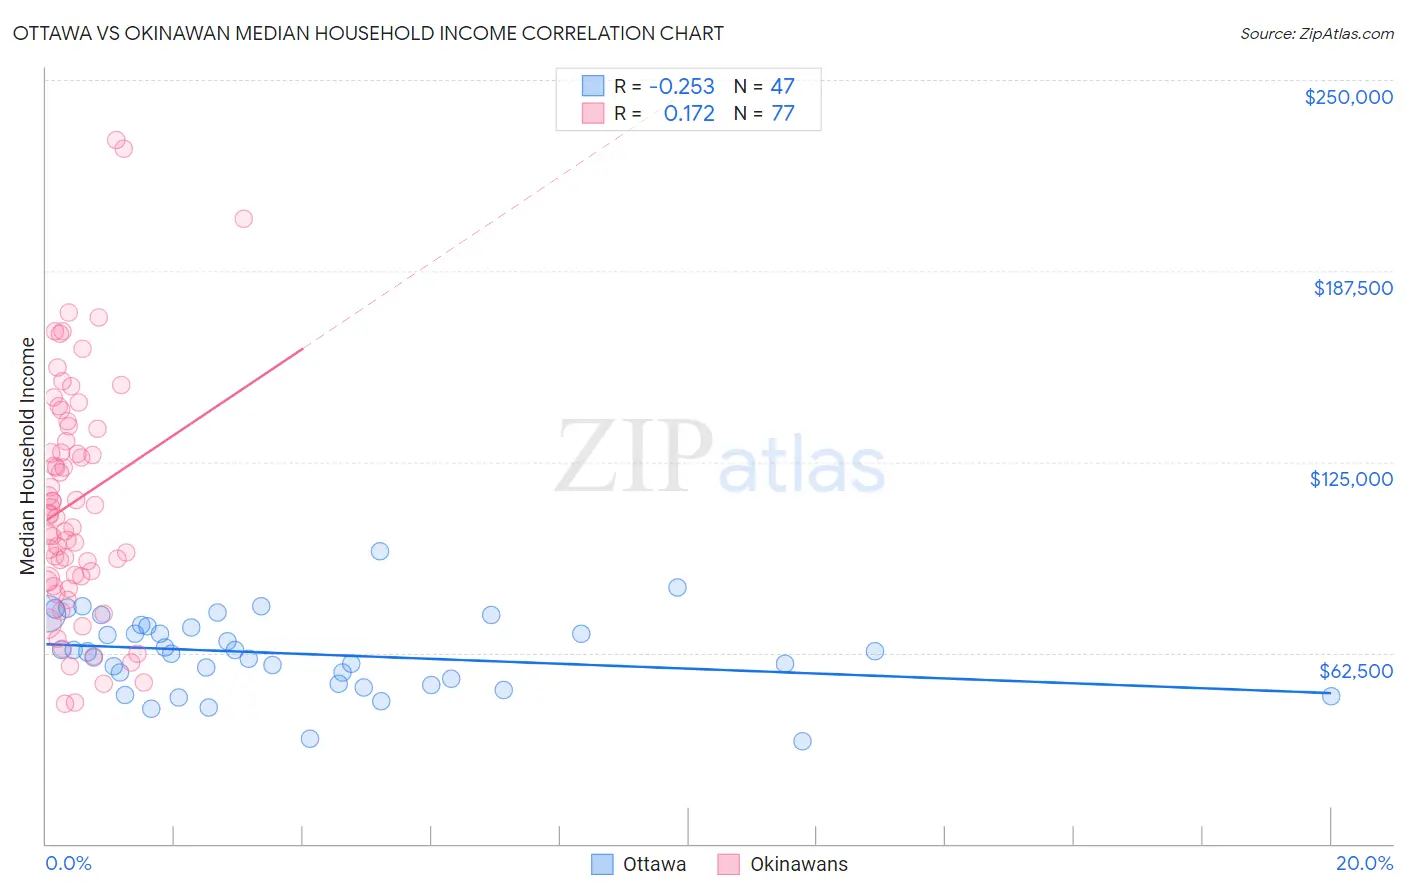
Ottawa vs Okinawan Median Household Income Correlation Chart
The statistical analysis conducted on geographies consisting of 49,944,469 people shows a weak negative correlation between the proportion of Ottawa and median household income in the United States with a correlation coefficient (R) of -0.253 and weighted average of $70,984. Similarly, the statistical analysis conducted on geographies consisting of 73,710,958 people shows a poor positive correlation between the proportion of Okinawans and median household income in the United States with a correlation coefficient (R) of 0.172 and weighted average of $106,624, a difference of 50.2%.
Median Household Income Correlation Summary
| Measurement | Ottawa | Okinawan |
| Minimum | $33,750 | $46,026 |
| Maximum | $95,750 | $230,434 |
| Range | $62,000 | $184,408 |
| Mean | $62,197 | $112,091 |
| Median | $62,810 | $107,483 |
| Interquartile 25% (IQ1) | $52,443 | $86,369 |
| Interquartile 75% (IQ3) | $71,315 | $136,400 |
| Interquartile Range (IQR) | $18,872 | $50,031 |
| Standard Deviation (Sample) | $12,658 | $39,077 |
| Standard Deviation (Population) | $12,523 | $38,823 |
Similar Demographics by Median Household Income
Demographics Similar to Ottawa by Median Household Income
In terms of median household income, the demographic groups most similar to Ottawa are Apache ($70,927, a difference of 0.080%), Dominican ($71,302, a difference of 0.45%), Immigrants from Bahamas ($71,349, a difference of 0.51%), Cajun ($70,605, a difference of 0.54%), and Chippewa ($70,539, a difference of 0.63%).
| Demographics | Rating | Rank | Median Household Income |
| Yakama | 0.0 /100 | #308 | Tragic $72,225 |
| Immigrants | Caribbean | 0.0 /100 | #309 | Tragic $71,860 |
| U.S. Virgin Islanders | 0.0 /100 | #310 | Tragic $71,853 |
| Immigrants | Zaire | 0.0 /100 | #311 | Tragic $71,801 |
| Immigrants | Honduras | 0.0 /100 | #312 | Tragic $71,452 |
| Immigrants | Bahamas | 0.0 /100 | #313 | Tragic $71,349 |
| Dominicans | 0.0 /100 | #314 | Tragic $71,302 |
| Ottawa | 0.0 /100 | #315 | Tragic $70,984 |
| Apache | 0.0 /100 | #316 | Tragic $70,927 |
| Cajuns | 0.0 /100 | #317 | Tragic $70,605 |
| Chippewa | 0.0 /100 | #318 | Tragic $70,539 |
| Immigrants | Dominican Republic | 0.0 /100 | #319 | Tragic $70,208 |
| Colville | 0.0 /100 | #320 | Tragic $70,094 |
| Chickasaw | 0.0 /100 | #321 | Tragic $70,005 |
| Choctaw | 0.0 /100 | #322 | Tragic $69,947 |
Demographics Similar to Okinawans by Median Household Income
In terms of median household income, the demographic groups most similar to Okinawans are Immigrants from South Central Asia ($106,057, a difference of 0.53%), Immigrants from China ($105,335, a difference of 1.2%), Indian (Asian) ($105,262, a difference of 1.3%), Immigrants from Iran ($108,055, a difference of 1.3%), and Immigrants from Eastern Asia ($104,796, a difference of 1.7%).
| Demographics | Rating | Rank | Median Household Income |
| Filipinos | 100.0 /100 | #2 | Exceptional $115,509 |
| Immigrants | India | 100.0 /100 | #3 | Exceptional $113,009 |
| Immigrants | Hong Kong | 100.0 /100 | #4 | Exceptional $111,519 |
| Thais | 100.0 /100 | #5 | Exceptional $110,648 |
| Immigrants | Singapore | 100.0 /100 | #6 | Exceptional $110,428 |
| Iranians | 100.0 /100 | #7 | Exceptional $109,835 |
| Immigrants | Iran | 100.0 /100 | #8 | Exceptional $108,055 |
| Okinawans | 100.0 /100 | #9 | Exceptional $106,624 |
| Immigrants | South Central Asia | 100.0 /100 | #10 | Exceptional $106,057 |
| Immigrants | China | 100.0 /100 | #11 | Exceptional $105,335 |
| Indians (Asian) | 100.0 /100 | #12 | Exceptional $105,262 |
| Immigrants | Eastern Asia | 100.0 /100 | #13 | Exceptional $104,796 |
| Immigrants | Ireland | 100.0 /100 | #14 | Exceptional $104,692 |
| Immigrants | Israel | 100.0 /100 | #15 | Exceptional $104,090 |
| Burmese | 100.0 /100 | #16 | Exceptional $103,145 |