Ottawa vs Colville Median Household Income
COMPARE
Ottawa
Colville
Median Household Income
Median Household Income Comparison
Ottawa
Colville
$70,984
MEDIAN HOUSEHOLD INCOME
0.0/ 100
METRIC RATING
315th/ 347
METRIC RANK
$70,094
MEDIAN HOUSEHOLD INCOME
0.0/ 100
METRIC RATING
320th/ 347
METRIC RANK
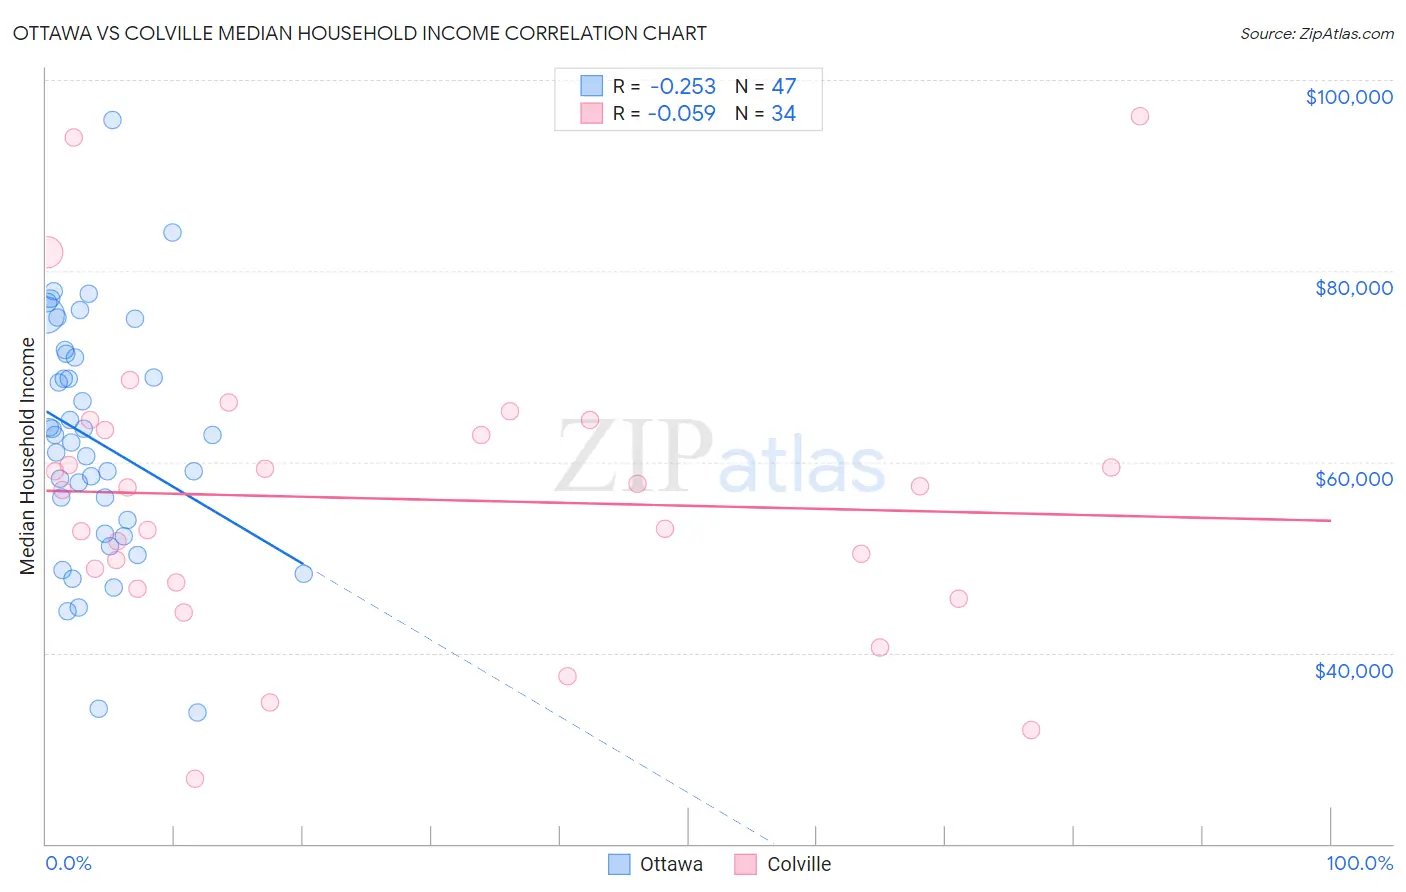
Ottawa vs Colville Median Household Income Correlation Chart
The statistical analysis conducted on geographies consisting of 49,944,469 people shows a weak negative correlation between the proportion of Ottawa and median household income in the United States with a correlation coefficient (R) of -0.253 and weighted average of $70,984. Similarly, the statistical analysis conducted on geographies consisting of 34,681,598 people shows a slight negative correlation between the proportion of Colville and median household income in the United States with a correlation coefficient (R) of -0.059 and weighted average of $70,094, a difference of 1.3%.
Median Household Income Correlation Summary
| Measurement | Ottawa | Colville |
| Minimum | $33,750 | $26,823 |
| Maximum | $95,750 | $96,250 |
| Range | $62,000 | $69,427 |
| Mean | $62,197 | $56,145 |
| Median | $62,810 | $57,218 |
| Interquartile 25% (IQ1) | $52,443 | $47,361 |
| Interquartile 75% (IQ3) | $71,315 | $63,313 |
| Interquartile Range (IQR) | $18,872 | $15,952 |
| Standard Deviation (Sample) | $12,658 | $14,989 |
| Standard Deviation (Population) | $12,523 | $14,767 |
Demographics Similar to Ottawa and Colville by Median Household Income
In terms of median household income, the demographic groups most similar to Ottawa are Apache ($70,927, a difference of 0.080%), Dominican ($71,302, a difference of 0.45%), Immigrants from Bahamas ($71,349, a difference of 0.51%), Cajun ($70,605, a difference of 0.54%), and Chippewa ($70,539, a difference of 0.63%). Similarly, the demographic groups most similar to Colville are Chickasaw ($70,005, a difference of 0.13%), Immigrants from Dominican Republic ($70,208, a difference of 0.16%), Choctaw ($69,947, a difference of 0.21%), Bahamian ($69,726, a difference of 0.53%), and Yup'ik ($69,695, a difference of 0.57%).
| Demographics | Rating | Rank | Median Household Income |
| Ute | 0.0 /100 | #307 | Tragic $72,402 |
| Yakama | 0.0 /100 | #308 | Tragic $72,225 |
| Immigrants | Caribbean | 0.0 /100 | #309 | Tragic $71,860 |
| U.S. Virgin Islanders | 0.0 /100 | #310 | Tragic $71,853 |
| Immigrants | Zaire | 0.0 /100 | #311 | Tragic $71,801 |
| Immigrants | Honduras | 0.0 /100 | #312 | Tragic $71,452 |
| Immigrants | Bahamas | 0.0 /100 | #313 | Tragic $71,349 |
| Dominicans | 0.0 /100 | #314 | Tragic $71,302 |
| Ottawa | 0.0 /100 | #315 | Tragic $70,984 |
| Apache | 0.0 /100 | #316 | Tragic $70,927 |
| Cajuns | 0.0 /100 | #317 | Tragic $70,605 |
| Chippewa | 0.0 /100 | #318 | Tragic $70,539 |
| Immigrants | Dominican Republic | 0.0 /100 | #319 | Tragic $70,208 |
| Colville | 0.0 /100 | #320 | Tragic $70,094 |
| Chickasaw | 0.0 /100 | #321 | Tragic $70,005 |
| Choctaw | 0.0 /100 | #322 | Tragic $69,947 |
| Bahamians | 0.0 /100 | #323 | Tragic $69,726 |
| Yup'ik | 0.0 /100 | #324 | Tragic $69,695 |
| Seminole | 0.0 /100 | #325 | Tragic $69,420 |
| Yuman | 0.0 /100 | #326 | Tragic $68,743 |
| Immigrants | Cuba | 0.0 /100 | #327 | Tragic $68,461 |