Immigrants from China vs Jordanian Median Household Income
COMPARE
Immigrants from China
Jordanian
Median Household Income
Median Household Income Comparison
Immigrants from China
Jordanians
$105,335
MEDIAN HOUSEHOLD INCOME
100.0/ 100
METRIC RATING
11th/ 347
METRIC RANK
$91,794
MEDIAN HOUSEHOLD INCOME
98.7/ 100
METRIC RATING
96th/ 347
METRIC RANK
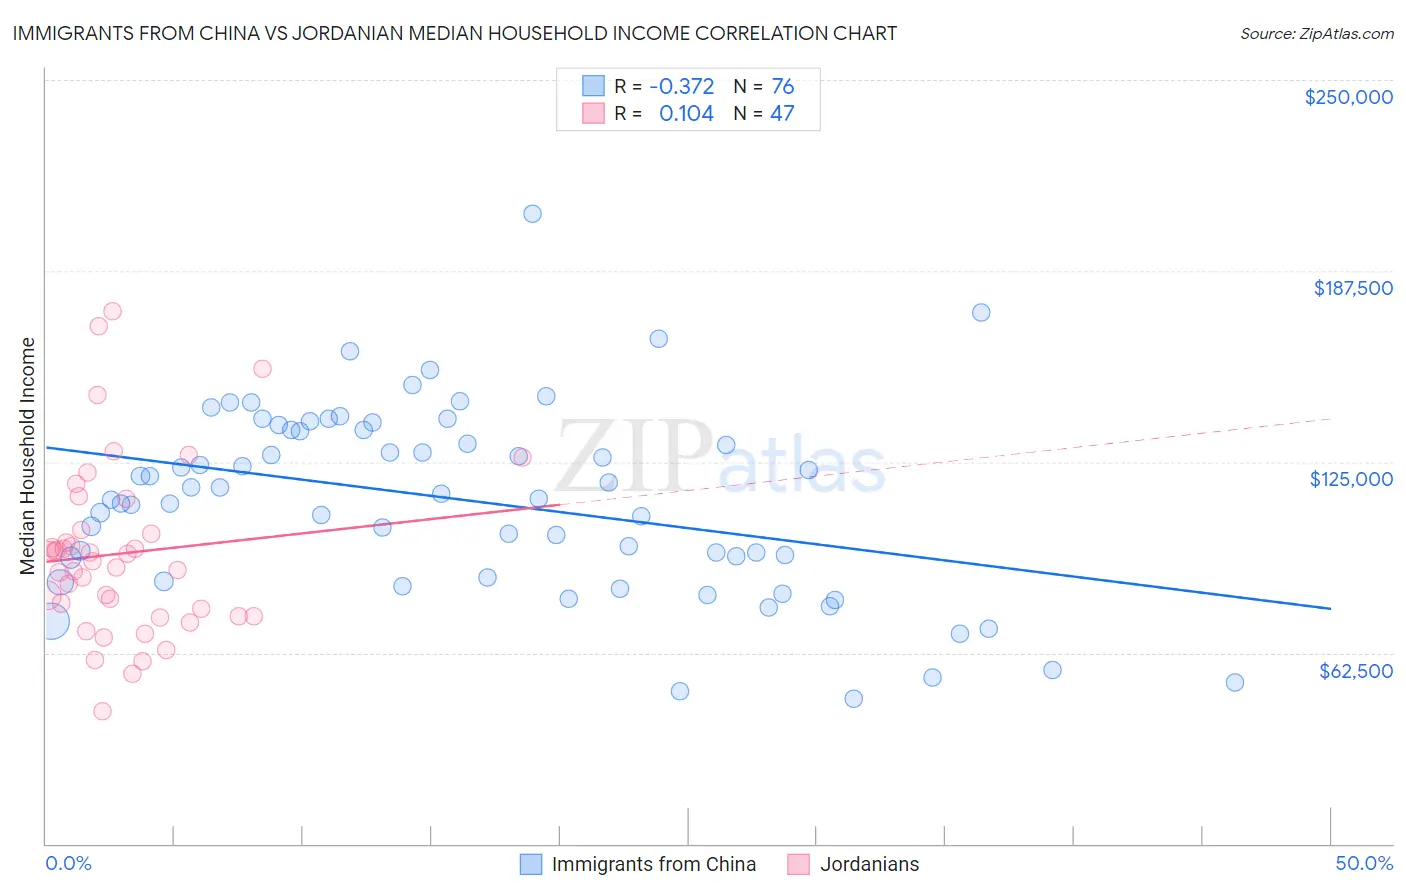
Immigrants from China vs Jordanian Median Household Income Correlation Chart
The statistical analysis conducted on geographies consisting of 456,448,801 people shows a mild negative correlation between the proportion of Immigrants from China and median household income in the United States with a correlation coefficient (R) of -0.372 and weighted average of $105,335. Similarly, the statistical analysis conducted on geographies consisting of 166,374,087 people shows a poor positive correlation between the proportion of Jordanians and median household income in the United States with a correlation coefficient (R) of 0.104 and weighted average of $91,794, a difference of 14.7%.
Median Household Income Correlation Summary
| Measurement | Immigrants from China | Jordanian |
| Minimum | $47,386 | $43,214 |
| Maximum | $206,336 | $174,260 |
| Range | $158,950 | $131,046 |
| Mean | $112,457 | $95,049 |
| Median | $113,740 | $92,429 |
| Interquartile 25% (IQ1) | $90,379 | $74,643 |
| Interquartile 75% (IQ3) | $135,564 | $102,895 |
| Interquartile Range (IQR) | $45,185 | $28,252 |
| Standard Deviation (Sample) | $30,829 | $28,123 |
| Standard Deviation (Population) | $30,625 | $27,822 |
Similar Demographics by Median Household Income
Demographics Similar to Immigrants from China by Median Household Income
In terms of median household income, the demographic groups most similar to Immigrants from China are Indian (Asian) ($105,262, a difference of 0.070%), Immigrants from Eastern Asia ($104,796, a difference of 0.51%), Immigrants from Ireland ($104,692, a difference of 0.61%), Immigrants from South Central Asia ($106,057, a difference of 0.69%), and Immigrants from Israel ($104,090, a difference of 1.2%).
| Demographics | Rating | Rank | Median Household Income |
| Immigrants | Hong Kong | 100.0 /100 | #4 | Exceptional $111,519 |
| Thais | 100.0 /100 | #5 | Exceptional $110,648 |
| Immigrants | Singapore | 100.0 /100 | #6 | Exceptional $110,428 |
| Iranians | 100.0 /100 | #7 | Exceptional $109,835 |
| Immigrants | Iran | 100.0 /100 | #8 | Exceptional $108,055 |
| Okinawans | 100.0 /100 | #9 | Exceptional $106,624 |
| Immigrants | South Central Asia | 100.0 /100 | #10 | Exceptional $106,057 |
| Immigrants | China | 100.0 /100 | #11 | Exceptional $105,335 |
| Indians (Asian) | 100.0 /100 | #12 | Exceptional $105,262 |
| Immigrants | Eastern Asia | 100.0 /100 | #13 | Exceptional $104,796 |
| Immigrants | Ireland | 100.0 /100 | #14 | Exceptional $104,692 |
| Immigrants | Israel | 100.0 /100 | #15 | Exceptional $104,090 |
| Burmese | 100.0 /100 | #16 | Exceptional $103,145 |
| Immigrants | Korea | 100.0 /100 | #17 | Exceptional $102,962 |
| Cypriots | 100.0 /100 | #18 | Exceptional $102,843 |
Demographics Similar to Jordanians by Median Household Income
In terms of median household income, the demographic groups most similar to Jordanians are Armenian ($91,807, a difference of 0.010%), Immigrants from North America ($91,860, a difference of 0.070%), Immigrants from Serbia ($91,730, a difference of 0.070%), Immigrants from Lebanon ($91,887, a difference of 0.10%), and Immigrants from Western Europe ($91,936, a difference of 0.15%).
| Demographics | Rating | Rank | Median Household Income |
| Romanians | 98.8 /100 | #89 | Exceptional $91,994 |
| Assyrians/Chaldeans/Syriacs | 98.8 /100 | #90 | Exceptional $91,991 |
| Immigrants | Vietnam | 98.8 /100 | #91 | Exceptional $91,987 |
| Immigrants | Western Europe | 98.8 /100 | #92 | Exceptional $91,936 |
| Immigrants | Lebanon | 98.7 /100 | #93 | Exceptional $91,887 |
| Immigrants | North America | 98.7 /100 | #94 | Exceptional $91,860 |
| Armenians | 98.7 /100 | #95 | Exceptional $91,807 |
| Jordanians | 98.7 /100 | #96 | Exceptional $91,794 |
| Immigrants | Serbia | 98.6 /100 | #97 | Exceptional $91,730 |
| Immigrants | Southern Europe | 98.5 /100 | #98 | Exceptional $91,605 |
| Immigrants | South Eastern Asia | 98.4 /100 | #99 | Exceptional $91,541 |
| Ukrainians | 98.3 /100 | #100 | Exceptional $91,456 |
| Immigrants | Moldova | 98.3 /100 | #101 | Exceptional $91,446 |
| Austrians | 98.2 /100 | #102 | Exceptional $91,339 |
| Immigrants | Ukraine | 98.0 /100 | #103 | Exceptional $91,124 |