Ottawa vs Haitian Median Household Income
COMPARE
Ottawa
Haitian
Median Household Income
Median Household Income Comparison
Ottawa
Haitians
$70,984
MEDIAN HOUSEHOLD INCOME
0.0/ 100
METRIC RATING
315th/ 347
METRIC RANK
$73,306
MEDIAN HOUSEHOLD INCOME
0.1/ 100
METRIC RATING
296th/ 347
METRIC RANK
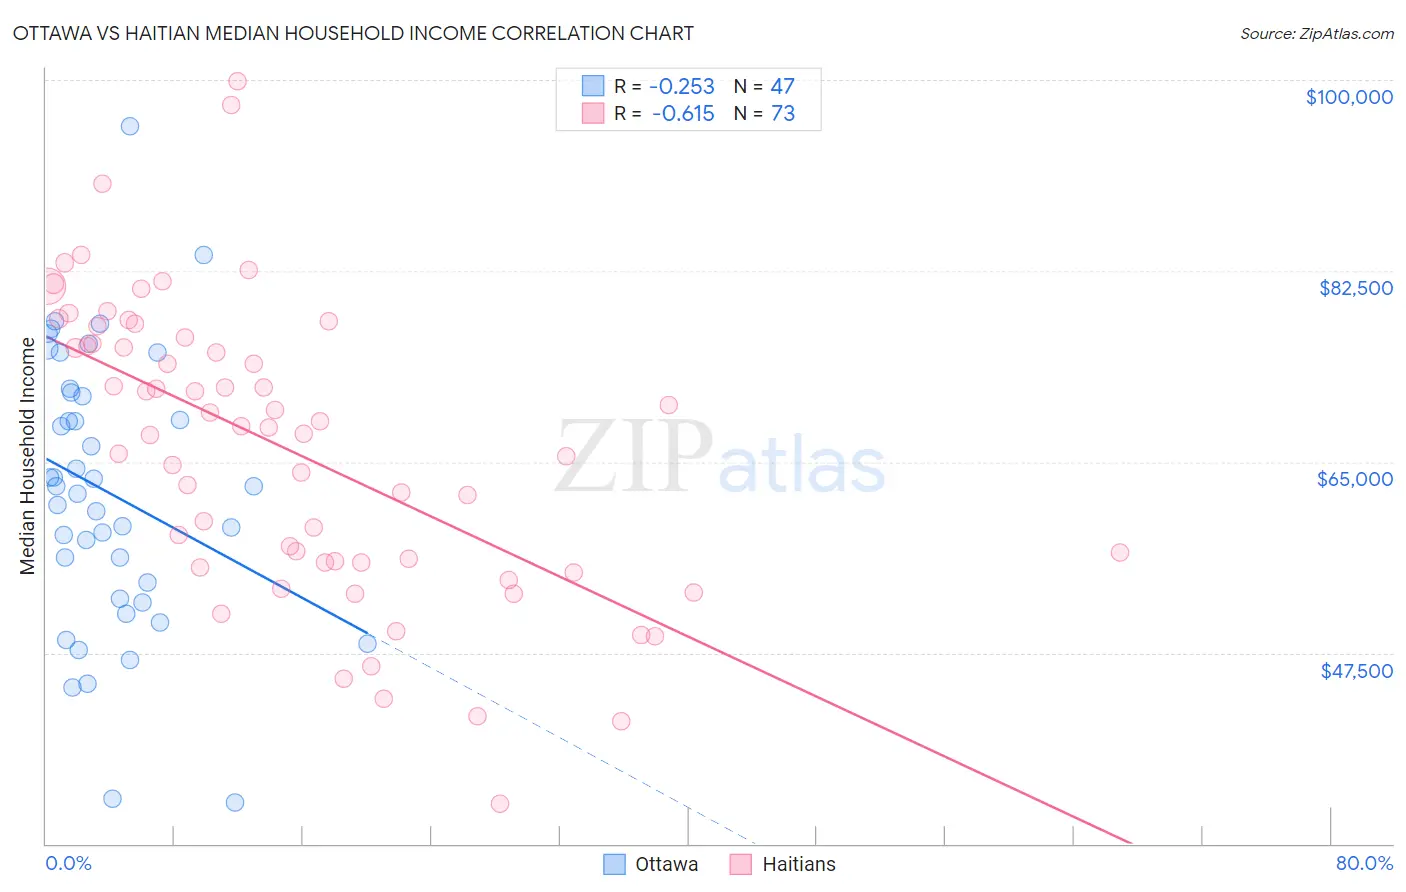
Ottawa vs Haitian Median Household Income Correlation Chart
The statistical analysis conducted on geographies consisting of 49,944,469 people shows a weak negative correlation between the proportion of Ottawa and median household income in the United States with a correlation coefficient (R) of -0.253 and weighted average of $70,984. Similarly, the statistical analysis conducted on geographies consisting of 287,615,576 people shows a significant negative correlation between the proportion of Haitians and median household income in the United States with a correlation coefficient (R) of -0.615 and weighted average of $73,306, a difference of 3.3%.
Median Household Income Correlation Summary
| Measurement | Ottawa | Haitian |
| Minimum | $33,750 | $33,629 |
| Maximum | $95,750 | $99,911 |
| Range | $62,000 | $66,282 |
| Mean | $62,197 | $66,249 |
| Median | $62,810 | $68,171 |
| Interquartile 25% (IQ1) | $52,443 | $55,796 |
| Interquartile 75% (IQ3) | $71,315 | $76,109 |
| Interquartile Range (IQR) | $18,872 | $20,312 |
| Standard Deviation (Sample) | $12,658 | $13,488 |
| Standard Deviation (Population) | $12,523 | $13,395 |
Demographics Similar to Ottawa and Haitians by Median Household Income
In terms of median household income, the demographic groups most similar to Ottawa are Dominican ($71,302, a difference of 0.45%), Immigrants from Bahamas ($71,349, a difference of 0.51%), Immigrants from Honduras ($71,452, a difference of 0.66%), Immigrants from Zaire ($71,801, a difference of 1.1%), and U.S. Virgin Islander ($71,853, a difference of 1.2%). Similarly, the demographic groups most similar to Haitians are Cuban ($73,392, a difference of 0.12%), Immigrants from Mexico ($73,160, a difference of 0.20%), Paiute ($72,959, a difference of 0.48%), Indonesian ($72,856, a difference of 0.62%), and Immigrants from Dominica ($72,760, a difference of 0.75%).
| Demographics | Rating | Rank | Median Household Income |
| Cubans | 0.1 /100 | #295 | Tragic $73,392 |
| Haitians | 0.1 /100 | #296 | Tragic $73,306 |
| Immigrants | Mexico | 0.0 /100 | #297 | Tragic $73,160 |
| Paiute | 0.0 /100 | #298 | Tragic $72,959 |
| Indonesians | 0.0 /100 | #299 | Tragic $72,856 |
| Immigrants | Dominica | 0.0 /100 | #300 | Tragic $72,760 |
| Cherokee | 0.0 /100 | #301 | Tragic $72,682 |
| Shoshone | 0.0 /100 | #302 | Tragic $72,660 |
| Africans | 0.0 /100 | #303 | Tragic $72,650 |
| Immigrants | Haiti | 0.0 /100 | #304 | Tragic $72,599 |
| Hondurans | 0.0 /100 | #305 | Tragic $72,588 |
| Potawatomi | 0.0 /100 | #306 | Tragic $72,576 |
| Ute | 0.0 /100 | #307 | Tragic $72,402 |
| Yakama | 0.0 /100 | #308 | Tragic $72,225 |
| Immigrants | Caribbean | 0.0 /100 | #309 | Tragic $71,860 |
| U.S. Virgin Islanders | 0.0 /100 | #310 | Tragic $71,853 |
| Immigrants | Zaire | 0.0 /100 | #311 | Tragic $71,801 |
| Immigrants | Honduras | 0.0 /100 | #312 | Tragic $71,452 |
| Immigrants | Bahamas | 0.0 /100 | #313 | Tragic $71,349 |
| Dominicans | 0.0 /100 | #314 | Tragic $71,302 |
| Ottawa | 0.0 /100 | #315 | Tragic $70,984 |