Immigrants from Belarus vs Jordanian Median Household Income
COMPARE
Immigrants from Belarus
Jordanian
Median Household Income
Median Household Income Comparison
Immigrants from Belarus
Jordanians
$94,399
MEDIAN HOUSEHOLD INCOME
99.7/ 100
METRIC RATING
65th/ 347
METRIC RANK
$91,794
MEDIAN HOUSEHOLD INCOME
98.7/ 100
METRIC RATING
96th/ 347
METRIC RANK
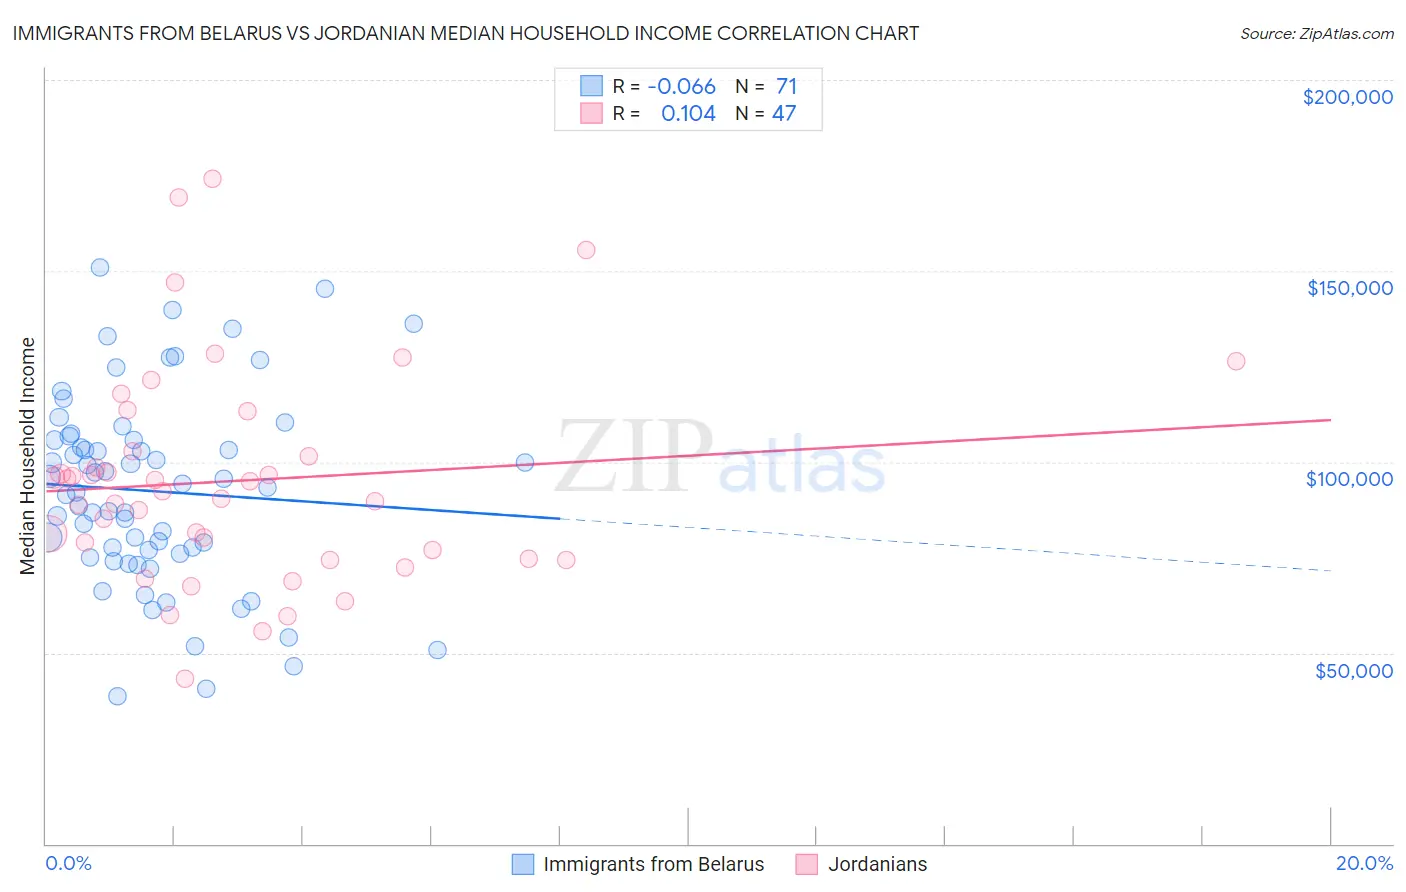
Immigrants from Belarus vs Jordanian Median Household Income Correlation Chart
The statistical analysis conducted on geographies consisting of 150,184,095 people shows a slight negative correlation between the proportion of Immigrants from Belarus and median household income in the United States with a correlation coefficient (R) of -0.066 and weighted average of $94,399. Similarly, the statistical analysis conducted on geographies consisting of 166,374,087 people shows a poor positive correlation between the proportion of Jordanians and median household income in the United States with a correlation coefficient (R) of 0.104 and weighted average of $91,794, a difference of 2.8%.
Median Household Income Correlation Summary
| Measurement | Immigrants from Belarus | Jordanian |
| Minimum | $38,670 | $43,214 |
| Maximum | $150,801 | $174,260 |
| Range | $112,131 | $131,046 |
| Mean | $92,306 | $95,049 |
| Median | $93,264 | $92,429 |
| Interquartile 25% (IQ1) | $75,784 | $74,643 |
| Interquartile 75% (IQ3) | $105,707 | $102,895 |
| Interquartile Range (IQR) | $29,923 | $28,252 |
| Standard Deviation (Sample) | $25,053 | $28,123 |
| Standard Deviation (Population) | $24,876 | $27,822 |
Similar Demographics by Median Household Income
Demographics Similar to Immigrants from Belarus by Median Household Income
In terms of median household income, the demographic groups most similar to Immigrants from Belarus are Immigrants from Netherlands ($94,411, a difference of 0.010%), Immigrants from Romania ($94,222, a difference of 0.19%), Immigrants from Scotland ($94,091, a difference of 0.33%), Greek ($94,735, a difference of 0.36%), and Mongolian ($93,971, a difference of 0.46%).
| Demographics | Rating | Rank | Median Household Income |
| Soviet Union | 99.8 /100 | #58 | Exceptional $95,098 |
| Immigrants | Europe | 99.8 /100 | #59 | Exceptional $95,032 |
| Koreans | 99.8 /100 | #60 | Exceptional $95,018 |
| Laotians | 99.8 /100 | #61 | Exceptional $94,990 |
| Immigrants | Norway | 99.8 /100 | #62 | Exceptional $94,846 |
| Greeks | 99.8 /100 | #63 | Exceptional $94,735 |
| Immigrants | Netherlands | 99.7 /100 | #64 | Exceptional $94,411 |
| Immigrants | Belarus | 99.7 /100 | #65 | Exceptional $94,399 |
| Immigrants | Romania | 99.7 /100 | #66 | Exceptional $94,222 |
| Immigrants | Scotland | 99.7 /100 | #67 | Exceptional $94,091 |
| Mongolians | 99.7 /100 | #68 | Exceptional $93,971 |
| Argentineans | 99.7 /100 | #69 | Exceptional $93,960 |
| Immigrants | Fiji | 99.7 /100 | #70 | Exceptional $93,933 |
| Immigrants | Philippines | 99.6 /100 | #71 | Exceptional $93,899 |
| Lithuanians | 99.6 /100 | #72 | Exceptional $93,852 |
Demographics Similar to Jordanians by Median Household Income
In terms of median household income, the demographic groups most similar to Jordanians are Armenian ($91,807, a difference of 0.010%), Immigrants from North America ($91,860, a difference of 0.070%), Immigrants from Serbia ($91,730, a difference of 0.070%), Immigrants from Lebanon ($91,887, a difference of 0.10%), and Immigrants from Western Europe ($91,936, a difference of 0.15%).
| Demographics | Rating | Rank | Median Household Income |
| Romanians | 98.8 /100 | #89 | Exceptional $91,994 |
| Assyrians/Chaldeans/Syriacs | 98.8 /100 | #90 | Exceptional $91,991 |
| Immigrants | Vietnam | 98.8 /100 | #91 | Exceptional $91,987 |
| Immigrants | Western Europe | 98.8 /100 | #92 | Exceptional $91,936 |
| Immigrants | Lebanon | 98.7 /100 | #93 | Exceptional $91,887 |
| Immigrants | North America | 98.7 /100 | #94 | Exceptional $91,860 |
| Armenians | 98.7 /100 | #95 | Exceptional $91,807 |
| Jordanians | 98.7 /100 | #96 | Exceptional $91,794 |
| Immigrants | Serbia | 98.6 /100 | #97 | Exceptional $91,730 |
| Immigrants | Southern Europe | 98.5 /100 | #98 | Exceptional $91,605 |
| Immigrants | South Eastern Asia | 98.4 /100 | #99 | Exceptional $91,541 |
| Ukrainians | 98.3 /100 | #100 | Exceptional $91,456 |
| Immigrants | Moldova | 98.3 /100 | #101 | Exceptional $91,446 |
| Austrians | 98.2 /100 | #102 | Exceptional $91,339 |
| Immigrants | Ukraine | 98.0 /100 | #103 | Exceptional $91,124 |