Immigrants from France vs Scotch-Irish Median Earnings
COMPARE
Immigrants from France
Scotch-Irish
Median Earnings
Median Earnings Comparison
Immigrants from France
Scotch-Irish
$53,490
MEDIAN EARNINGS
100.0/ 100
METRIC RATING
28th/ 347
METRIC RANK
$44,924
MEDIAN EARNINGS
10.7/ 100
METRIC RATING
229th/ 347
METRIC RANK
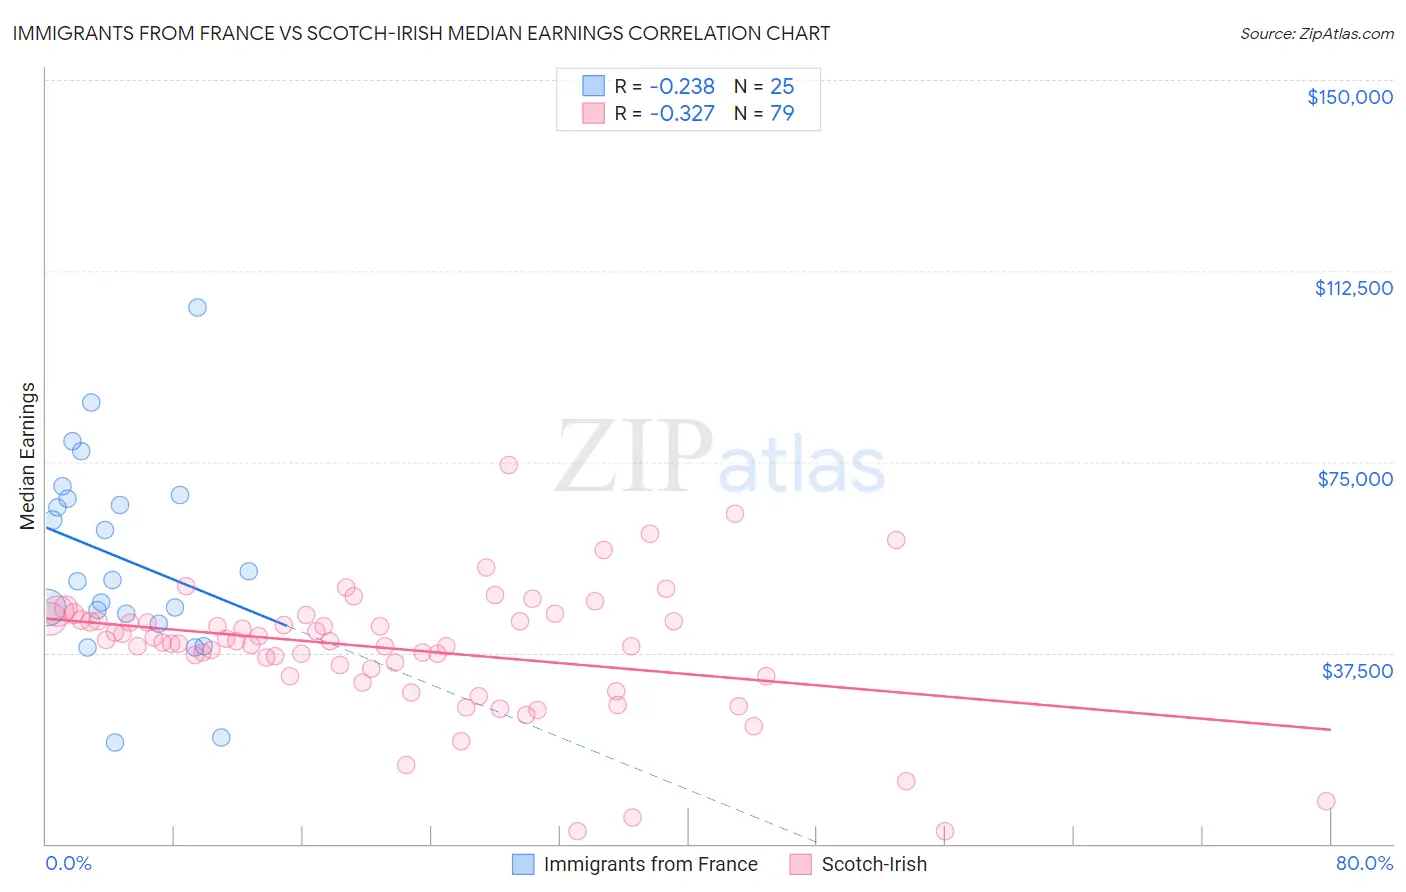
Immigrants from France vs Scotch-Irish Median Earnings Correlation Chart
The statistical analysis conducted on geographies consisting of 287,897,093 people shows a weak negative correlation between the proportion of Immigrants from France and median earnings in the United States with a correlation coefficient (R) of -0.238 and weighted average of $53,490. Similarly, the statistical analysis conducted on geographies consisting of 548,498,961 people shows a mild negative correlation between the proportion of Scotch-Irish and median earnings in the United States with a correlation coefficient (R) of -0.327 and weighted average of $44,924, a difference of 19.1%.
Median Earnings Correlation Summary
| Measurement | Immigrants from France | Scotch-Irish |
| Minimum | $19,781 | $2,499 |
| Maximum | $105,221 | $74,508 |
| Range | $85,440 | $72,009 |
| Mean | $56,012 | $38,268 |
| Median | $51,881 | $39,708 |
| Interquartile 25% (IQ1) | $44,190 | $32,986 |
| Interquartile 75% (IQ3) | $68,204 | $43,991 |
| Interquartile Range (IQR) | $24,013 | $11,005 |
| Standard Deviation (Sample) | $19,673 | $12,720 |
| Standard Deviation (Population) | $19,276 | $12,639 |
Similar Demographics by Median Earnings
Demographics Similar to Immigrants from France by Median Earnings
In terms of median earnings, the demographic groups most similar to Immigrants from France are Immigrants from Russia ($53,457, a difference of 0.060%), Cambodian ($53,386, a difference of 0.20%), Russian ($53,334, a difference of 0.29%), Immigrants from Asia ($53,310, a difference of 0.34%), and Asian ($53,690, a difference of 0.37%).
| Demographics | Rating | Rank | Median Earnings |
| Burmese | 100.0 /100 | #21 | Exceptional $54,559 |
| Immigrants | Korea | 100.0 /100 | #22 | Exceptional $54,530 |
| Immigrants | Sweden | 100.0 /100 | #23 | Exceptional $54,478 |
| Soviet Union | 100.0 /100 | #24 | Exceptional $54,290 |
| Turks | 100.0 /100 | #25 | Exceptional $53,919 |
| Immigrants | Northern Europe | 100.0 /100 | #26 | Exceptional $53,872 |
| Asians | 100.0 /100 | #27 | Exceptional $53,690 |
| Immigrants | France | 100.0 /100 | #28 | Exceptional $53,490 |
| Immigrants | Russia | 100.0 /100 | #29 | Exceptional $53,457 |
| Cambodians | 100.0 /100 | #30 | Exceptional $53,386 |
| Russians | 100.0 /100 | #31 | Exceptional $53,334 |
| Immigrants | Asia | 100.0 /100 | #32 | Exceptional $53,310 |
| Immigrants | Greece | 100.0 /100 | #33 | Exceptional $53,282 |
| Immigrants | Sri Lanka | 100.0 /100 | #34 | Exceptional $53,268 |
| Immigrants | Switzerland | 100.0 /100 | #35 | Exceptional $53,211 |
Demographics Similar to Scotch-Irish by Median Earnings
In terms of median earnings, the demographic groups most similar to Scotch-Irish are Immigrants from Western Africa ($44,893, a difference of 0.070%), Immigrants from Iraq ($44,988, a difference of 0.14%), Japanese ($44,825, a difference of 0.22%), Native Hawaiian ($45,027, a difference of 0.23%), and Immigrants from Nigeria ($45,030, a difference of 0.24%).
| Demographics | Rating | Rank | Median Earnings |
| Immigrants | Panama | 15.0 /100 | #222 | Poor $45,198 |
| Whites/Caucasians | 15.0 /100 | #223 | Poor $45,197 |
| West Indians | 13.9 /100 | #224 | Poor $45,132 |
| Immigrants | Cambodia | 13.2 /100 | #225 | Poor $45,090 |
| Immigrants | Nigeria | 12.2 /100 | #226 | Poor $45,030 |
| Native Hawaiians | 12.2 /100 | #227 | Poor $45,027 |
| Immigrants | Iraq | 11.6 /100 | #228 | Poor $44,988 |
| Scotch-Irish | 10.7 /100 | #229 | Poor $44,924 |
| Immigrants | Western Africa | 10.3 /100 | #230 | Poor $44,893 |
| Japanese | 9.5 /100 | #231 | Tragic $44,825 |
| Delaware | 9.0 /100 | #232 | Tragic $44,783 |
| Immigrants | Sudan | 8.8 /100 | #233 | Tragic $44,767 |
| Cape Verdeans | 7.5 /100 | #234 | Tragic $44,640 |
| Venezuelans | 6.9 /100 | #235 | Tragic $44,580 |
| British West Indians | 6.7 /100 | #236 | Tragic $44,552 |