Immigrants from Southern Europe vs Scotch-Irish Median Earnings
COMPARE
Immigrants from Southern Europe
Scotch-Irish
Median Earnings
Median Earnings Comparison
Immigrants from Southern Europe
Scotch-Irish
$50,280
MEDIAN EARNINGS
99.6/ 100
METRIC RATING
81st/ 347
METRIC RANK
$44,924
MEDIAN EARNINGS
10.7/ 100
METRIC RATING
229th/ 347
METRIC RANK
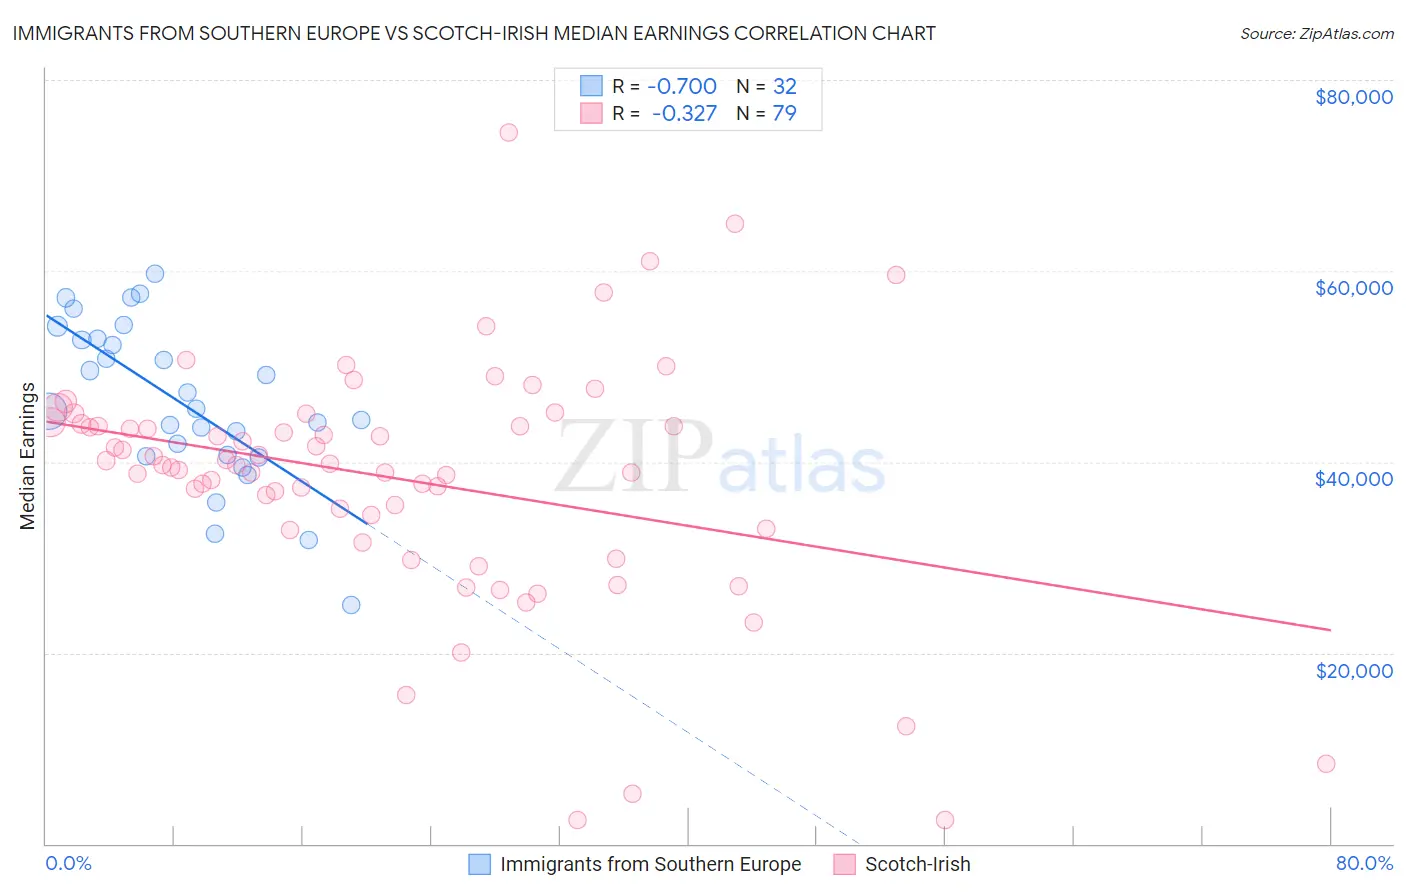
Immigrants from Southern Europe vs Scotch-Irish Median Earnings Correlation Chart
The statistical analysis conducted on geographies consisting of 402,763,457 people shows a significant negative correlation between the proportion of Immigrants from Southern Europe and median earnings in the United States with a correlation coefficient (R) of -0.700 and weighted average of $50,280. Similarly, the statistical analysis conducted on geographies consisting of 548,498,961 people shows a mild negative correlation between the proportion of Scotch-Irish and median earnings in the United States with a correlation coefficient (R) of -0.327 and weighted average of $44,924, a difference of 11.9%.
Median Earnings Correlation Summary
| Measurement | Immigrants from Southern Europe | Scotch-Irish |
| Minimum | $25,046 | $2,499 |
| Maximum | $59,687 | $74,508 |
| Range | $34,641 | $72,009 |
| Mean | $46,213 | $38,268 |
| Median | $45,445 | $39,708 |
| Interquartile 25% (IQ1) | $40,648 | $32,986 |
| Interquartile 75% (IQ3) | $52,864 | $43,991 |
| Interquartile Range (IQR) | $12,216 | $11,005 |
| Standard Deviation (Sample) | $8,358 | $12,720 |
| Standard Deviation (Population) | $8,227 | $12,639 |
Similar Demographics by Median Earnings
Demographics Similar to Immigrants from Southern Europe by Median Earnings
In terms of median earnings, the demographic groups most similar to Immigrants from Southern Europe are Immigrants from Moldova ($50,274, a difference of 0.010%), Romanian ($50,244, a difference of 0.070%), Ukrainian ($50,320, a difference of 0.080%), Immigrants from Hungary ($50,227, a difference of 0.11%), and Immigrants from Kazakhstan ($50,225, a difference of 0.11%).
| Demographics | Rating | Rank | Median Earnings |
| South Africans | 99.8 /100 | #74 | Exceptional $50,752 |
| Immigrants | Scotland | 99.8 /100 | #75 | Exceptional $50,741 |
| Immigrants | Italy | 99.7 /100 | #76 | Exceptional $50,581 |
| Immigrants | Western Europe | 99.7 /100 | #77 | Exceptional $50,549 |
| Argentineans | 99.6 /100 | #78 | Exceptional $50,399 |
| Laotians | 99.6 /100 | #79 | Exceptional $50,343 |
| Ukrainians | 99.6 /100 | #80 | Exceptional $50,320 |
| Immigrants | Southern Europe | 99.6 /100 | #81 | Exceptional $50,280 |
| Immigrants | Moldova | 99.5 /100 | #82 | Exceptional $50,274 |
| Romanians | 99.5 /100 | #83 | Exceptional $50,244 |
| Immigrants | Hungary | 99.5 /100 | #84 | Exceptional $50,227 |
| Immigrants | Kazakhstan | 99.5 /100 | #85 | Exceptional $50,225 |
| Immigrants | Canada | 99.5 /100 | #86 | Exceptional $50,192 |
| Immigrants | Uzbekistan | 99.5 /100 | #87 | Exceptional $50,151 |
| Albanians | 99.4 /100 | #88 | Exceptional $50,116 |
Demographics Similar to Scotch-Irish by Median Earnings
In terms of median earnings, the demographic groups most similar to Scotch-Irish are Immigrants from Western Africa ($44,893, a difference of 0.070%), Immigrants from Iraq ($44,988, a difference of 0.14%), Japanese ($44,825, a difference of 0.22%), Native Hawaiian ($45,027, a difference of 0.23%), and Immigrants from Nigeria ($45,030, a difference of 0.24%).
| Demographics | Rating | Rank | Median Earnings |
| Immigrants | Panama | 15.0 /100 | #222 | Poor $45,198 |
| Whites/Caucasians | 15.0 /100 | #223 | Poor $45,197 |
| West Indians | 13.9 /100 | #224 | Poor $45,132 |
| Immigrants | Cambodia | 13.2 /100 | #225 | Poor $45,090 |
| Immigrants | Nigeria | 12.2 /100 | #226 | Poor $45,030 |
| Native Hawaiians | 12.2 /100 | #227 | Poor $45,027 |
| Immigrants | Iraq | 11.6 /100 | #228 | Poor $44,988 |
| Scotch-Irish | 10.7 /100 | #229 | Poor $44,924 |
| Immigrants | Western Africa | 10.3 /100 | #230 | Poor $44,893 |
| Japanese | 9.5 /100 | #231 | Tragic $44,825 |
| Delaware | 9.0 /100 | #232 | Tragic $44,783 |
| Immigrants | Sudan | 8.8 /100 | #233 | Tragic $44,767 |
| Cape Verdeans | 7.5 /100 | #234 | Tragic $44,640 |
| Venezuelans | 6.9 /100 | #235 | Tragic $44,580 |
| British West Indians | 6.7 /100 | #236 | Tragic $44,552 |