Immigrants from Dominican Republic vs Canadian Median Earnings
COMPARE
Immigrants from Dominican Republic
Canadian
Median Earnings
Median Earnings Comparison
Immigrants from Dominican Republic
Canadians
$41,554
MEDIAN EARNINGS
0.1/ 100
METRIC RATING
288th/ 347
METRIC RANK
$47,911
MEDIAN EARNINGS
88.8/ 100
METRIC RATING
139th/ 347
METRIC RANK
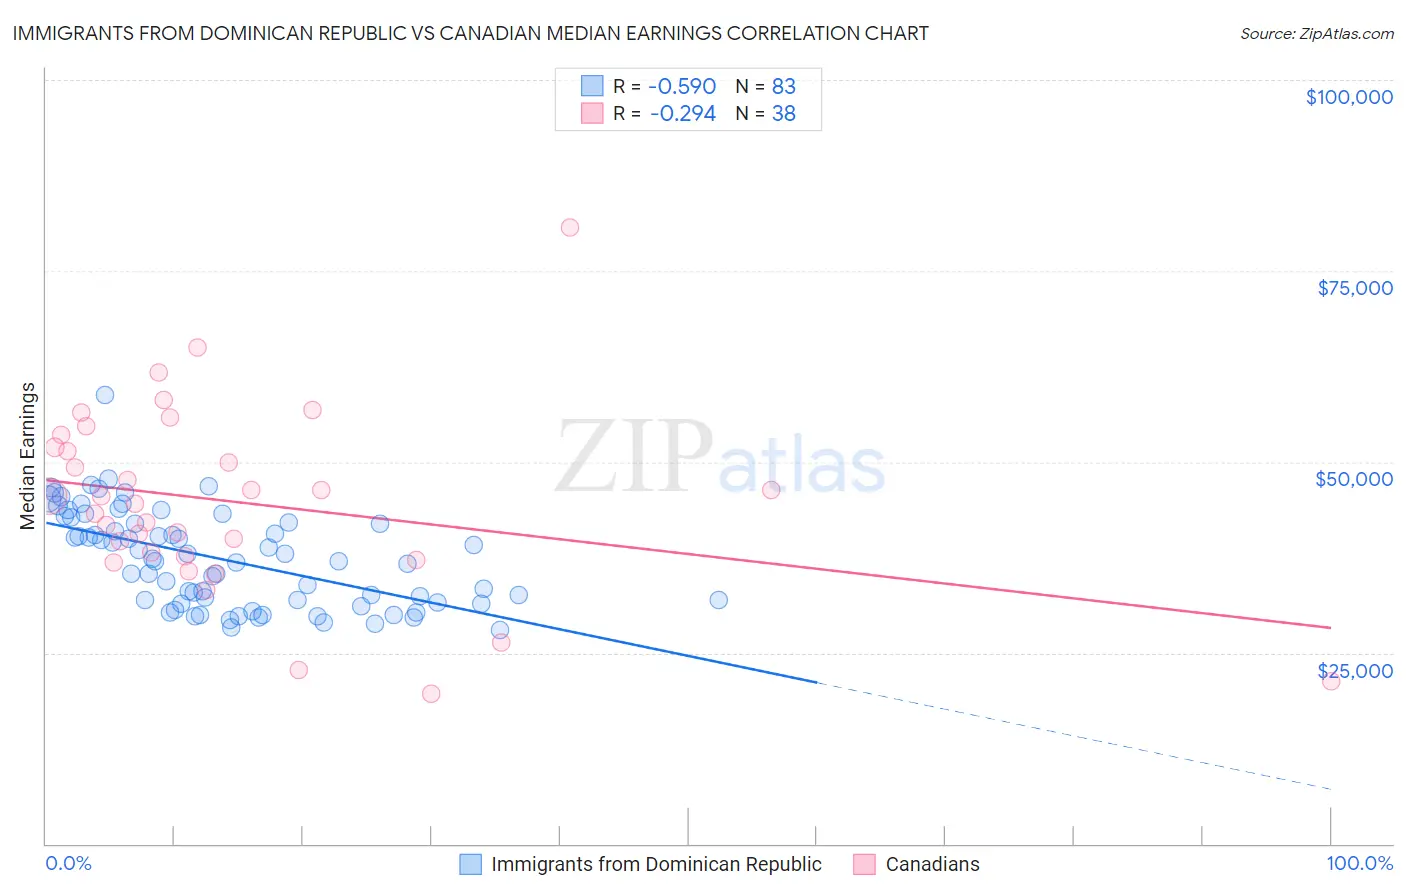
Immigrants from Dominican Republic vs Canadian Median Earnings Correlation Chart
The statistical analysis conducted on geographies consisting of 275,134,235 people shows a substantial negative correlation between the proportion of Immigrants from Dominican Republic and median earnings in the United States with a correlation coefficient (R) of -0.590 and weighted average of $41,554. Similarly, the statistical analysis conducted on geographies consisting of 437,494,547 people shows a weak negative correlation between the proportion of Canadians and median earnings in the United States with a correlation coefficient (R) of -0.294 and weighted average of $47,911, a difference of 15.3%.
Median Earnings Correlation Summary
| Measurement | Immigrants from Dominican Republic | Canadian |
| Minimum | $28,009 | $19,688 |
| Maximum | $58,780 | $80,682 |
| Range | $30,771 | $60,994 |
| Mean | $37,276 | $44,712 |
| Median | $37,042 | $44,948 |
| Interquartile 25% (IQ1) | $31,535 | $37,642 |
| Interquartile 75% (IQ3) | $42,082 | $51,935 |
| Interquartile Range (IQR) | $10,547 | $14,293 |
| Standard Deviation (Sample) | $6,269 | $12,220 |
| Standard Deviation (Population) | $6,231 | $12,058 |
Similar Demographics by Median Earnings
Demographics Similar to Immigrants from Dominican Republic by Median Earnings
In terms of median earnings, the demographic groups most similar to Immigrants from Dominican Republic are Comanche ($41,519, a difference of 0.080%), Paiute ($41,508, a difference of 0.11%), Central American Indian ($41,474, a difference of 0.19%), U.S. Virgin Islander ($41,448, a difference of 0.26%), and Indonesian ($41,701, a difference of 0.35%).
| Demographics | Rating | Rank | Median Earnings |
| Marshallese | 0.2 /100 | #281 | Tragic $41,969 |
| Africans | 0.2 /100 | #282 | Tragic $41,955 |
| Dominicans | 0.2 /100 | #283 | Tragic $41,864 |
| Blackfeet | 0.2 /100 | #284 | Tragic $41,822 |
| Immigrants | Nicaragua | 0.1 /100 | #285 | Tragic $41,737 |
| Mexican American Indians | 0.1 /100 | #286 | Tragic $41,719 |
| Indonesians | 0.1 /100 | #287 | Tragic $41,701 |
| Immigrants | Dominican Republic | 0.1 /100 | #288 | Tragic $41,554 |
| Comanche | 0.1 /100 | #289 | Tragic $41,519 |
| Paiute | 0.1 /100 | #290 | Tragic $41,508 |
| Central American Indians | 0.1 /100 | #291 | Tragic $41,474 |
| U.S. Virgin Islanders | 0.1 /100 | #292 | Tragic $41,448 |
| Immigrants | Zaire | 0.1 /100 | #293 | Tragic $41,325 |
| Potawatomi | 0.1 /100 | #294 | Tragic $41,288 |
| Bangladeshis | 0.1 /100 | #295 | Tragic $41,263 |
Demographics Similar to Canadians by Median Earnings
In terms of median earnings, the demographic groups most similar to Canadians are European ($47,915, a difference of 0.010%), Taiwanese ($47,902, a difference of 0.020%), Immigrants from Nepal ($47,925, a difference of 0.030%), Immigrants from Sierra Leone ($47,875, a difference of 0.080%), and Ugandan ($47,854, a difference of 0.12%).
| Demographics | Rating | Rank | Median Earnings |
| British | 92.2 /100 | #132 | Exceptional $48,189 |
| Immigrants | Uganda | 90.5 /100 | #133 | Exceptional $48,041 |
| Sri Lankans | 90.5 /100 | #134 | Exceptional $48,040 |
| Portuguese | 90.4 /100 | #135 | Exceptional $48,032 |
| Slovenes | 90.0 /100 | #136 | Excellent $47,995 |
| Immigrants | Nepal | 89.0 /100 | #137 | Excellent $47,925 |
| Europeans | 88.9 /100 | #138 | Excellent $47,915 |
| Canadians | 88.8 /100 | #139 | Excellent $47,911 |
| Taiwanese | 88.7 /100 | #140 | Excellent $47,902 |
| Immigrants | Sierra Leone | 88.3 /100 | #141 | Excellent $47,875 |
| Ugandans | 88.0 /100 | #142 | Excellent $47,854 |
| Swedes | 88.0 /100 | #143 | Excellent $47,851 |
| Hungarians | 87.1 /100 | #144 | Excellent $47,795 |
| Immigrants | Saudi Arabia | 85.6 /100 | #145 | Excellent $47,704 |
| Immigrants | Chile | 85.5 /100 | #146 | Excellent $47,697 |