Lebanese vs Canadian Median Earnings
COMPARE
Lebanese
Canadian
Median Earnings
Median Earnings Comparison
Lebanese
Canadians
$48,226
MEDIAN EARNINGS
92.5/ 100
METRIC RATING
131st/ 347
METRIC RANK
$47,911
MEDIAN EARNINGS
88.8/ 100
METRIC RATING
139th/ 347
METRIC RANK
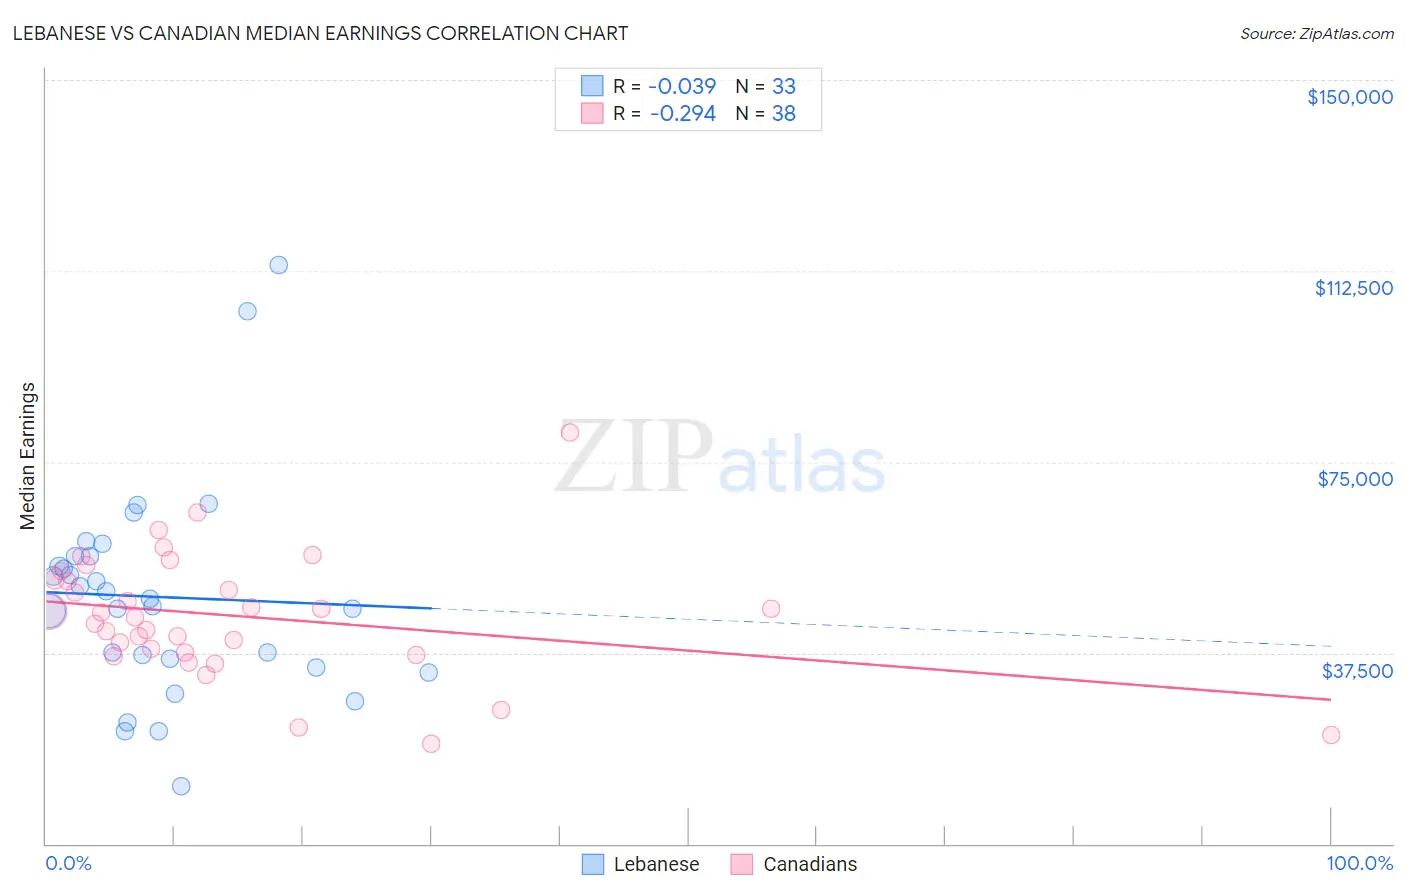
Lebanese vs Canadian Median Earnings Correlation Chart
The statistical analysis conducted on geographies consisting of 401,606,109 people shows no correlation between the proportion of Lebanese and median earnings in the United States with a correlation coefficient (R) of -0.039 and weighted average of $48,226. Similarly, the statistical analysis conducted on geographies consisting of 437,494,547 people shows a weak negative correlation between the proportion of Canadians and median earnings in the United States with a correlation coefficient (R) of -0.294 and weighted average of $47,911, a difference of 0.66%.
Median Earnings Correlation Summary
| Measurement | Lebanese | Canadian |
| Minimum | $11,384 | $19,688 |
| Maximum | $113,646 | $80,682 |
| Range | $102,262 | $60,994 |
| Mean | $48,478 | $44,712 |
| Median | $48,125 | $44,948 |
| Interquartile 25% (IQ1) | $35,416 | $37,642 |
| Interquartile 75% (IQ3) | $56,506 | $51,935 |
| Interquartile Range (IQR) | $21,090 | $14,293 |
| Standard Deviation (Sample) | $20,869 | $12,220 |
| Standard Deviation (Population) | $20,550 | $12,058 |
Demographics Similar to Lebanese and Canadians by Median Earnings
In terms of median earnings, the demographic groups most similar to Lebanese are Zimbabwean ($48,229, a difference of 0.010%), Pakistani ($48,254, a difference of 0.060%), Immigrants from Philippines ($48,266, a difference of 0.080%), British ($48,189, a difference of 0.080%), and Sierra Leonean ($48,286, a difference of 0.12%). Similarly, the demographic groups most similar to Canadians are European ($47,915, a difference of 0.010%), Taiwanese ($47,902, a difference of 0.020%), Immigrants from Nepal ($47,925, a difference of 0.030%), Immigrants from Sierra Leone ($47,875, a difference of 0.080%), and Ugandan ($47,854, a difference of 0.12%).
| Demographics | Rating | Rank | Median Earnings |
| Immigrants | Fiji | 93.3 /100 | #125 | Exceptional $48,305 |
| Assyrians/Chaldeans/Syriacs | 93.3 /100 | #126 | Exceptional $48,304 |
| Sierra Leoneans | 93.1 /100 | #127 | Exceptional $48,286 |
| Immigrants | Philippines | 92.9 /100 | #128 | Exceptional $48,266 |
| Pakistanis | 92.8 /100 | #129 | Exceptional $48,254 |
| Zimbabweans | 92.6 /100 | #130 | Exceptional $48,229 |
| Lebanese | 92.5 /100 | #131 | Exceptional $48,226 |
| British | 92.2 /100 | #132 | Exceptional $48,189 |
| Immigrants | Uganda | 90.5 /100 | #133 | Exceptional $48,041 |
| Sri Lankans | 90.5 /100 | #134 | Exceptional $48,040 |
| Portuguese | 90.4 /100 | #135 | Exceptional $48,032 |
| Slovenes | 90.0 /100 | #136 | Excellent $47,995 |
| Immigrants | Nepal | 89.0 /100 | #137 | Excellent $47,925 |
| Europeans | 88.9 /100 | #138 | Excellent $47,915 |
| Canadians | 88.8 /100 | #139 | Excellent $47,911 |
| Taiwanese | 88.7 /100 | #140 | Excellent $47,902 |
| Immigrants | Sierra Leone | 88.3 /100 | #141 | Excellent $47,875 |
| Ugandans | 88.0 /100 | #142 | Excellent $47,854 |
| Swedes | 88.0 /100 | #143 | Excellent $47,851 |
| Hungarians | 87.1 /100 | #144 | Excellent $47,795 |
| Immigrants | Saudi Arabia | 85.6 /100 | #145 | Excellent $47,704 |