Immigrants from Latin America vs Arab Median Family Income
COMPARE
Immigrants from Latin America
Arab
Median Family Income
Median Family Income Comparison
Immigrants from Latin America
Arabs
$86,989
MEDIAN FAMILY INCOME
0.0/ 100
METRIC RATING
298th/ 347
METRIC RANK
$106,952
MEDIAN FAMILY INCOME
89.9/ 100
METRIC RATING
129th/ 347
METRIC RANK
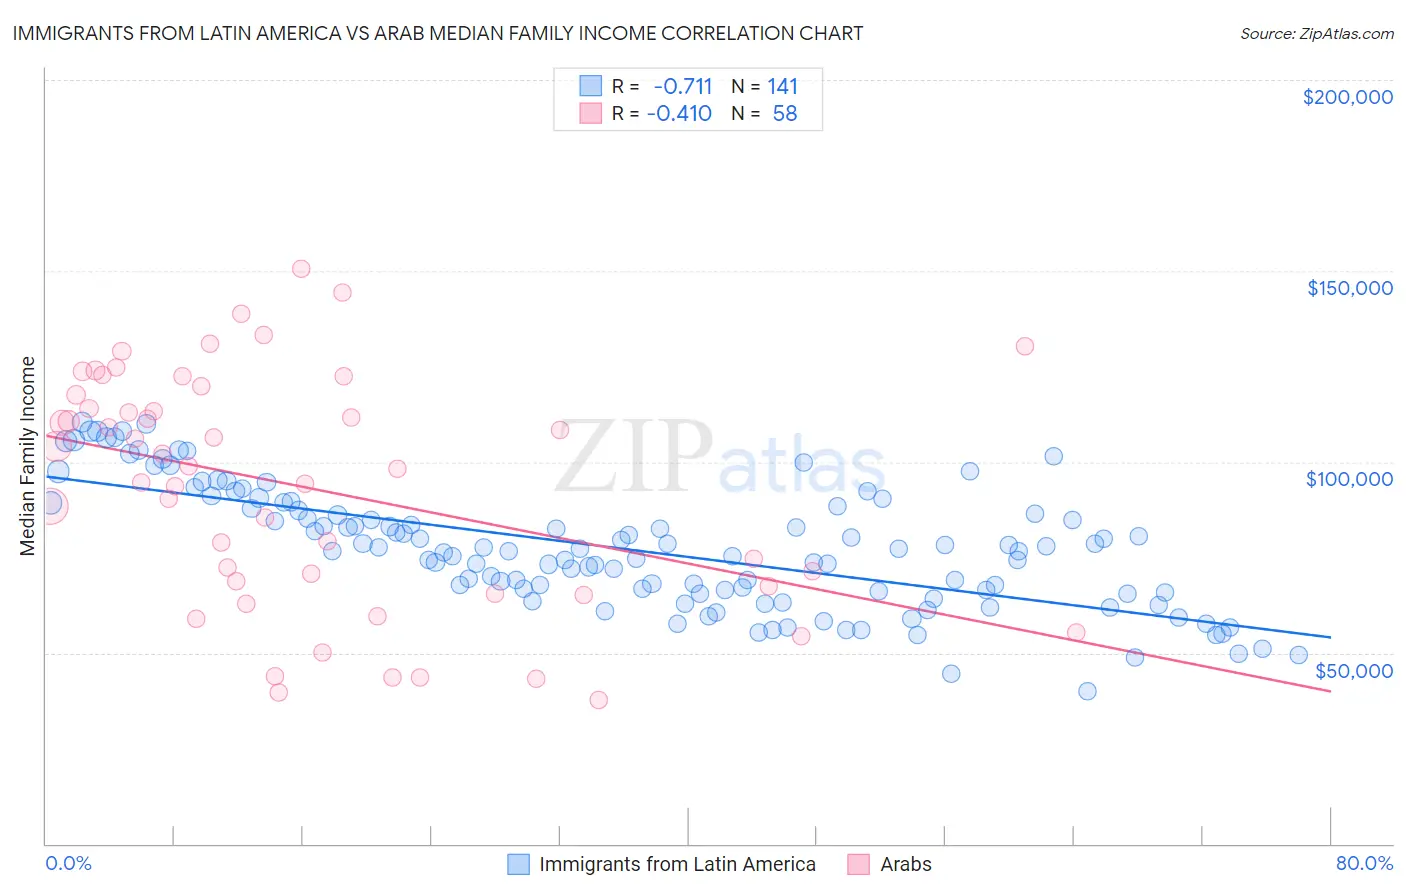
Immigrants from Latin America vs Arab Median Family Income Correlation Chart
The statistical analysis conducted on geographies consisting of 557,337,898 people shows a strong negative correlation between the proportion of Immigrants from Latin America and median family income in the United States with a correlation coefficient (R) of -0.711 and weighted average of $86,989. Similarly, the statistical analysis conducted on geographies consisting of 486,153,527 people shows a moderate negative correlation between the proportion of Arabs and median family income in the United States with a correlation coefficient (R) of -0.410 and weighted average of $106,952, a difference of 23.0%.
Median Family Income Correlation Summary
| Measurement | Immigrants from Latin America | Arab |
| Minimum | $39,785 | $37,540 |
| Maximum | $110,302 | $150,441 |
| Range | $70,517 | $112,901 |
| Mean | $77,259 | $93,185 |
| Median | $76,749 | $98,519 |
| Interquartile 25% (IQ1) | $66,005 | $67,570 |
| Interquartile 75% (IQ3) | $88,129 | $117,614 |
| Interquartile Range (IQR) | $22,124 | $50,044 |
| Standard Deviation (Sample) | $15,813 | $30,451 |
| Standard Deviation (Population) | $15,756 | $30,188 |
Similar Demographics by Median Family Income
Demographics Similar to Immigrants from Latin America by Median Family Income
In terms of median family income, the demographic groups most similar to Immigrants from Latin America are Chippewa ($86,852, a difference of 0.16%), Cajun ($87,157, a difference of 0.19%), Immigrants from Guatemala ($87,191, a difference of 0.23%), Yaqui ($87,289, a difference of 0.34%), and Fijian ($87,387, a difference of 0.46%).
| Demographics | Rating | Rank | Median Family Income |
| Immigrants | Cabo Verde | 0.1 /100 | #291 | Tragic $87,830 |
| Africans | 0.1 /100 | #292 | Tragic $87,820 |
| Ute | 0.0 /100 | #293 | Tragic $87,596 |
| Fijians | 0.0 /100 | #294 | Tragic $87,387 |
| Yaqui | 0.0 /100 | #295 | Tragic $87,289 |
| Immigrants | Guatemala | 0.0 /100 | #296 | Tragic $87,191 |
| Cajuns | 0.0 /100 | #297 | Tragic $87,157 |
| Immigrants | Latin America | 0.0 /100 | #298 | Tragic $86,989 |
| Chippewa | 0.0 /100 | #299 | Tragic $86,852 |
| Ottawa | 0.0 /100 | #300 | Tragic $86,380 |
| Colville | 0.0 /100 | #301 | Tragic $85,792 |
| Spanish American Indians | 0.0 /100 | #302 | Tragic $85,728 |
| Hispanics or Latinos | 0.0 /100 | #303 | Tragic $85,647 |
| Mexicans | 0.0 /100 | #304 | Tragic $85,618 |
| Paiute | 0.0 /100 | #305 | Tragic $85,414 |
Demographics Similar to Arabs by Median Family Income
In terms of median family income, the demographic groups most similar to Arabs are Brazilian ($106,942, a difference of 0.010%), Immigrants from Ethiopia ($106,969, a difference of 0.020%), Lebanese ($107,086, a difference of 0.12%), Serbian ($107,157, a difference of 0.19%), and Taiwanese ($107,295, a difference of 0.32%).
| Demographics | Rating | Rank | Median Family Income |
| Immigrants | Jordan | 92.9 /100 | #122 | Exceptional $107,715 |
| Carpatho Rusyns | 92.2 /100 | #123 | Exceptional $107,502 |
| Pakistanis | 91.7 /100 | #124 | Exceptional $107,390 |
| Taiwanese | 91.4 /100 | #125 | Exceptional $107,295 |
| Serbians | 90.8 /100 | #126 | Exceptional $107,157 |
| Lebanese | 90.5 /100 | #127 | Exceptional $107,086 |
| Immigrants | Ethiopia | 90.0 /100 | #128 | Excellent $106,969 |
| Arabs | 89.9 /100 | #129 | Excellent $106,952 |
| Brazilians | 89.8 /100 | #130 | Excellent $106,942 |
| Canadians | 88.1 /100 | #131 | Excellent $106,597 |
| Immigrants | Fiji | 87.8 /100 | #132 | Excellent $106,544 |
| Ugandans | 87.8 /100 | #133 | Excellent $106,541 |
| Immigrants | Oceania | 87.3 /100 | #134 | Excellent $106,453 |
| Portuguese | 86.3 /100 | #135 | Excellent $106,286 |
| Immigrants | South Eastern Asia | 86.1 /100 | #136 | Excellent $106,252 |