Immigrants from Western Asia vs Arab Median Family Income
COMPARE
Immigrants from Western Asia
Arab
Median Family Income
Median Family Income Comparison
Immigrants from Western Asia
Arabs
$108,691
MEDIAN FAMILY INCOME
95.6/ 100
METRIC RATING
111th/ 347
METRIC RANK
$106,952
MEDIAN FAMILY INCOME
89.9/ 100
METRIC RATING
129th/ 347
METRIC RANK
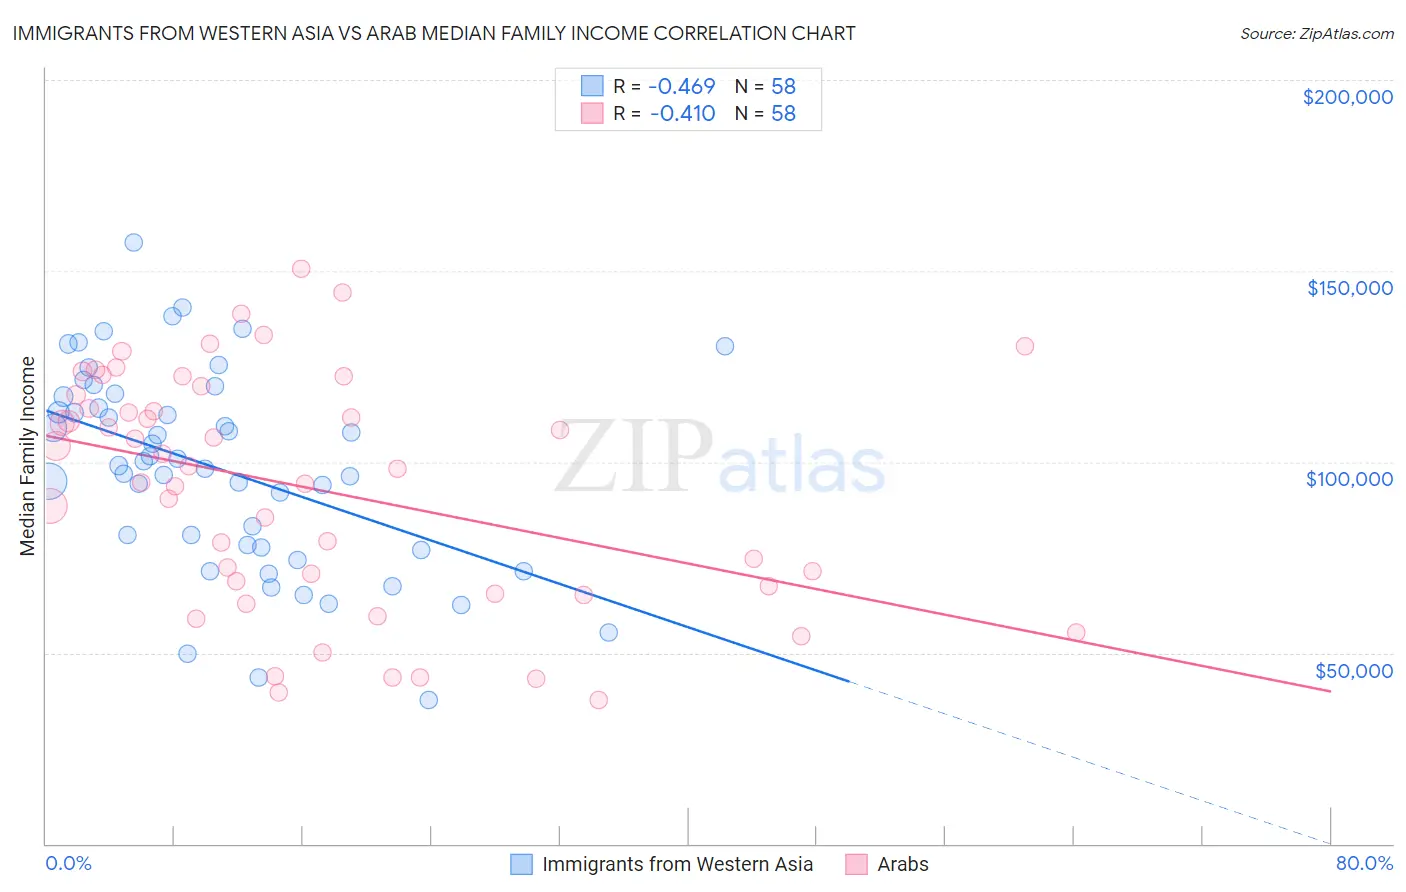
Immigrants from Western Asia vs Arab Median Family Income Correlation Chart
The statistical analysis conducted on geographies consisting of 404,054,166 people shows a moderate negative correlation between the proportion of Immigrants from Western Asia and median family income in the United States with a correlation coefficient (R) of -0.469 and weighted average of $108,691. Similarly, the statistical analysis conducted on geographies consisting of 486,153,527 people shows a moderate negative correlation between the proportion of Arabs and median family income in the United States with a correlation coefficient (R) of -0.410 and weighted average of $106,952, a difference of 1.6%.
Median Family Income Correlation Summary
| Measurement | Immigrants from Western Asia | Arab |
| Minimum | $37,540 | $37,540 |
| Maximum | $157,455 | $150,441 |
| Range | $119,915 | $112,901 |
| Mean | $98,085 | $93,185 |
| Median | $99,522 | $98,519 |
| Interquartile 25% (IQ1) | $77,576 | $67,570 |
| Interquartile 75% (IQ3) | $117,037 | $117,614 |
| Interquartile Range (IQR) | $39,461 | $50,044 |
| Standard Deviation (Sample) | $26,265 | $30,451 |
| Standard Deviation (Population) | $26,038 | $30,188 |
Demographics Similar to Immigrants from Western Asia and Arabs by Median Family Income
In terms of median family income, the demographic groups most similar to Immigrants from Western Asia are British ($108,705, a difference of 0.010%), Immigrants from Poland ($108,570, a difference of 0.11%), Immigrants from Saudi Arabia ($108,544, a difference of 0.14%), Polish ($108,507, a difference of 0.17%), and Swedish ($108,499, a difference of 0.18%). Similarly, the demographic groups most similar to Arabs are Brazilian ($106,942, a difference of 0.010%), Immigrants from Ethiopia ($106,969, a difference of 0.020%), Lebanese ($107,086, a difference of 0.12%), Serbian ($107,157, a difference of 0.19%), and Taiwanese ($107,295, a difference of 0.32%).
| Demographics | Rating | Rank | Median Family Income |
| British | 95.6 /100 | #110 | Exceptional $108,705 |
| Immigrants | Western Asia | 95.6 /100 | #111 | Exceptional $108,691 |
| Immigrants | Poland | 95.3 /100 | #112 | Exceptional $108,570 |
| Immigrants | Saudi Arabia | 95.2 /100 | #113 | Exceptional $108,544 |
| Poles | 95.2 /100 | #114 | Exceptional $108,507 |
| Swedes | 95.1 /100 | #115 | Exceptional $108,499 |
| Chileans | 95.0 /100 | #116 | Exceptional $108,429 |
| Immigrants | Philippines | 94.6 /100 | #117 | Exceptional $108,288 |
| Ethiopians | 94.5 /100 | #118 | Exceptional $108,251 |
| Sri Lankans | 94.5 /100 | #119 | Exceptional $108,234 |
| Immigrants | Northern Africa | 94.3 /100 | #120 | Exceptional $108,161 |
| Europeans | 94.1 /100 | #121 | Exceptional $108,099 |
| Immigrants | Jordan | 92.9 /100 | #122 | Exceptional $107,715 |
| Carpatho Rusyns | 92.2 /100 | #123 | Exceptional $107,502 |
| Pakistanis | 91.7 /100 | #124 | Exceptional $107,390 |
| Taiwanese | 91.4 /100 | #125 | Exceptional $107,295 |
| Serbians | 90.8 /100 | #126 | Exceptional $107,157 |
| Lebanese | 90.5 /100 | #127 | Exceptional $107,086 |
| Immigrants | Ethiopia | 90.0 /100 | #128 | Excellent $106,969 |
| Arabs | 89.9 /100 | #129 | Excellent $106,952 |
| Brazilians | 89.8 /100 | #130 | Excellent $106,942 |