Okinawan vs Spanish American Wage/Income Gap
COMPARE
Okinawan
Spanish American
Wage/Income Gap
Wage/Income Gap Comparison
Okinawans
Spanish Americans
28.1%
WAGE/INCOME GAP
0.4/ 100
METRIC RATING
287th/ 347
METRIC RANK
24.6%
WAGE/INCOME GAP
93.8/ 100
METRIC RATING
125th/ 347
METRIC RANK
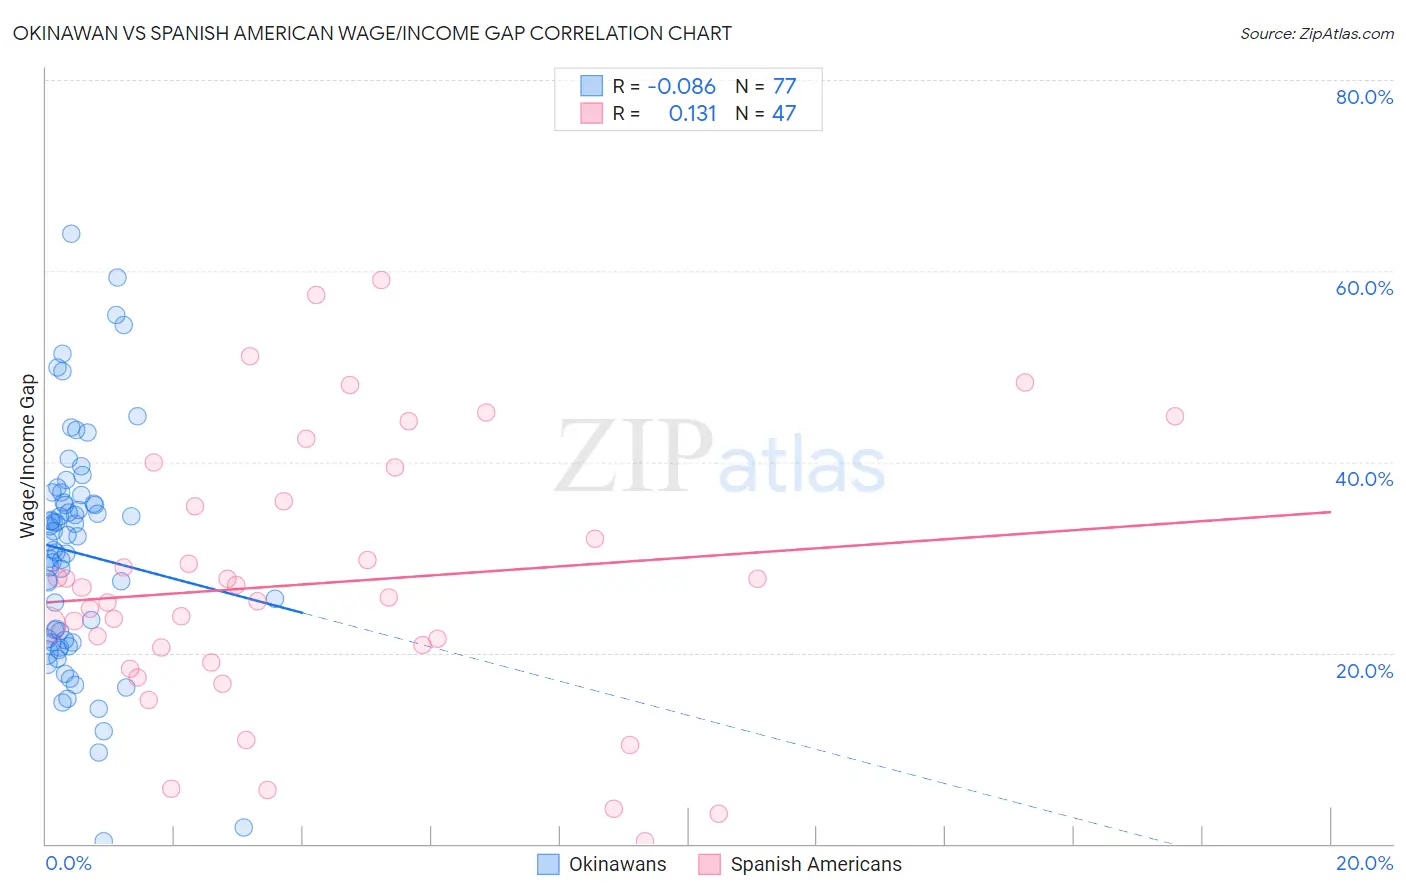
Okinawan vs Spanish American Wage/Income Gap Correlation Chart
The statistical analysis conducted on geographies consisting of 73,760,182 people shows a slight negative correlation between the proportion of Okinawans and wage/income gap percentage in the United States with a correlation coefficient (R) of -0.086 and weighted average of 28.1%. Similarly, the statistical analysis conducted on geographies consisting of 103,143,152 people shows a poor positive correlation between the proportion of Spanish Americans and wage/income gap percentage in the United States with a correlation coefficient (R) of 0.131 and weighted average of 24.6%, a difference of 14.2%.
Wage/Income Gap Correlation Summary
| Measurement | Okinawan | Spanish American |
| Minimum | 0.26% | 0.29% |
| Maximum | 63.9% | 59.1% |
| Range | 63.7% | 58.8% |
| Mean | 30.5% | 27.3% |
| Median | 31.7% | 25.8% |
| Interquartile 25% (IQ1) | 21.3% | 19.0% |
| Interquartile 75% (IQ3) | 36.2% | 35.8% |
| Interquartile Range (IQR) | 14.9% | 16.8% |
| Standard Deviation (Sample) | 12.1% | 14.0% |
| Standard Deviation (Population) | 12.0% | 13.9% |
Similar Demographics by Wage/Income Gap
Demographics Similar to Okinawans by Wage/Income Gap
In terms of wage/income gap, the demographic groups most similar to Okinawans are Immigrants from Austria (28.1%, a difference of 0.040%), Choctaw (28.1%, a difference of 0.040%), Italian (28.1%, a difference of 0.070%), Canadian (28.1%, a difference of 0.070%), and Australian (28.2%, a difference of 0.16%).
| Demographics | Rating | Rank | Wage/Income Gap |
| Russians | 0.5 /100 | #280 | Tragic 28.0% |
| Burmese | 0.5 /100 | #281 | Tragic 28.0% |
| South Africans | 0.5 /100 | #282 | Tragic 28.0% |
| French Canadians | 0.4 /100 | #283 | Tragic 28.1% |
| Immigrants | Sweden | 0.4 /100 | #284 | Tragic 28.1% |
| Italians | 0.4 /100 | #285 | Tragic 28.1% |
| Immigrants | Austria | 0.4 /100 | #286 | Tragic 28.1% |
| Okinawans | 0.4 /100 | #287 | Tragic 28.1% |
| Choctaw | 0.4 /100 | #288 | Tragic 28.1% |
| Canadians | 0.3 /100 | #289 | Tragic 28.1% |
| Australians | 0.3 /100 | #290 | Tragic 28.2% |
| Czechoslovakians | 0.3 /100 | #291 | Tragic 28.2% |
| Immigrants | Australia | 0.3 /100 | #292 | Tragic 28.2% |
| Immigrants | Israel | 0.3 /100 | #293 | Tragic 28.2% |
| Greeks | 0.3 /100 | #294 | Tragic 28.2% |
Demographics Similar to Spanish Americans by Wage/Income Gap
In terms of wage/income gap, the demographic groups most similar to Spanish Americans are Immigrants from South America (24.6%, a difference of 0.020%), Immigrants from Uruguay (24.6%, a difference of 0.020%), German Russian (24.6%, a difference of 0.020%), Immigrants from Central America (24.6%, a difference of 0.090%), and Yup'ik (24.7%, a difference of 0.14%).
| Demographics | Rating | Rank | Wage/Income Gap |
| Immigrants | Micronesia | 95.8 /100 | #118 | Exceptional 24.4% |
| Kenyans | 95.8 /100 | #119 | Exceptional 24.5% |
| Cree | 95.6 /100 | #120 | Exceptional 24.5% |
| Immigrants | Thailand | 94.9 /100 | #121 | Exceptional 24.5% |
| Apache | 94.8 /100 | #122 | Exceptional 24.5% |
| Natives/Alaskans | 94.6 /100 | #123 | Exceptional 24.6% |
| Immigrants | South America | 93.9 /100 | #124 | Exceptional 24.6% |
| Spanish Americans | 93.8 /100 | #125 | Exceptional 24.6% |
| Immigrants | Uruguay | 93.8 /100 | #126 | Exceptional 24.6% |
| German Russians | 93.7 /100 | #127 | Exceptional 24.6% |
| Immigrants | Central America | 93.5 /100 | #128 | Exceptional 24.6% |
| Yup'ik | 93.3 /100 | #129 | Exceptional 24.7% |
| Alsatians | 93.2 /100 | #130 | Exceptional 24.7% |
| Immigrants | Philippines | 93.0 /100 | #131 | Exceptional 24.7% |
| Immigrants | Costa Rica | 92.4 /100 | #132 | Exceptional 24.7% |