Norwegian vs European Professional Degree
COMPARE
Norwegian
European
Professional Degree
Professional Degree Comparison
Norwegians
Europeans
4.2%
PROFESSIONAL DEGREE
20.5/ 100
METRIC RATING
199th/ 347
METRIC RANK
4.8%
PROFESSIONAL DEGREE
93.2/ 100
METRIC RATING
126th/ 347
METRIC RANK
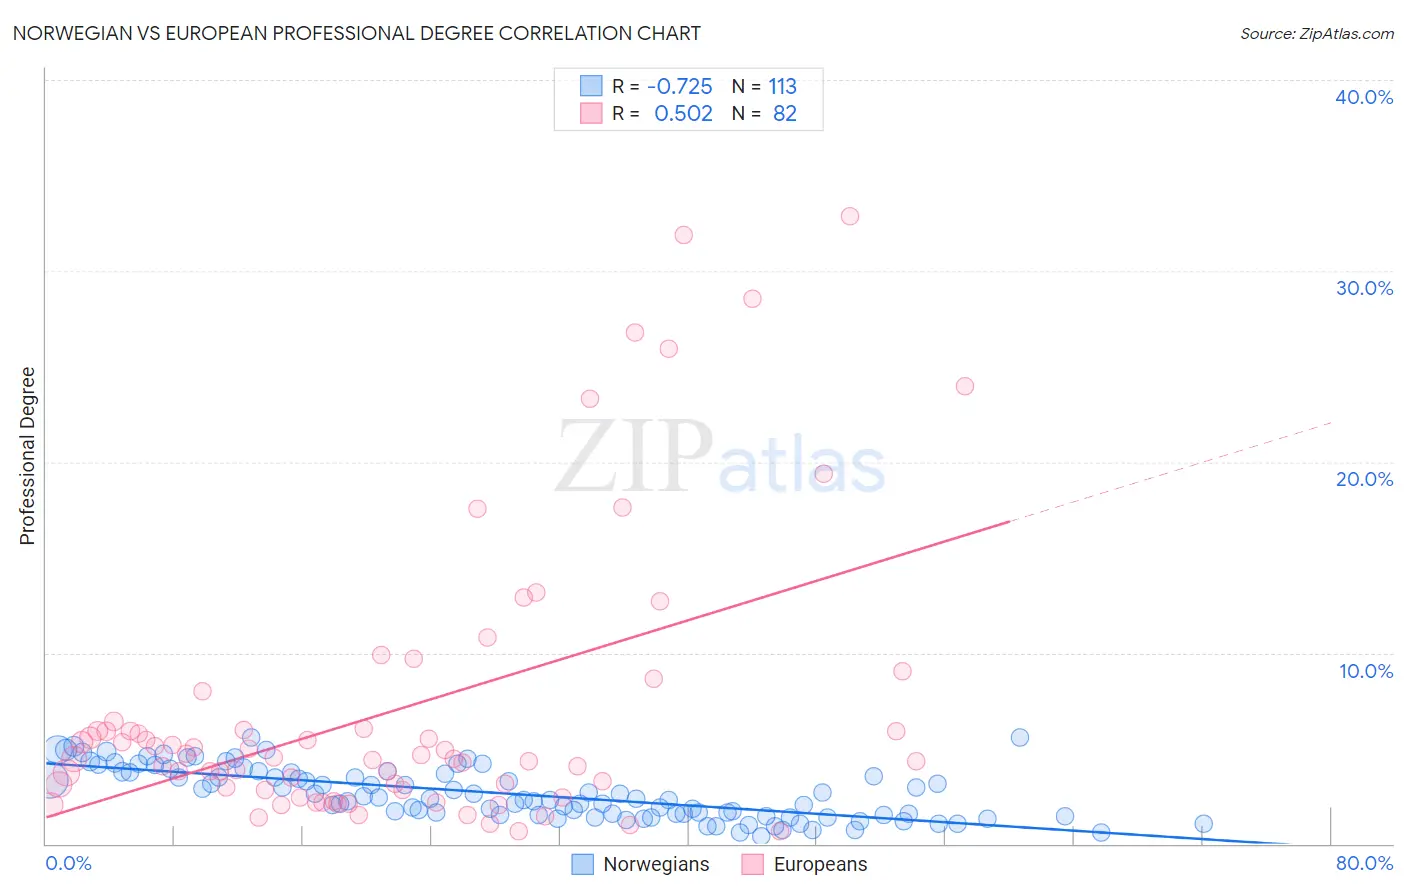
Norwegian vs European Professional Degree Correlation Chart
The statistical analysis conducted on geographies consisting of 528,458,292 people shows a strong negative correlation between the proportion of Norwegians and percentage of population with at least professional degree education in the United States with a correlation coefficient (R) of -0.725 and weighted average of 4.2%. Similarly, the statistical analysis conducted on geographies consisting of 555,066,624 people shows a substantial positive correlation between the proportion of Europeans and percentage of population with at least professional degree education in the United States with a correlation coefficient (R) of 0.502 and weighted average of 4.8%, a difference of 15.1%.
Professional Degree Correlation Summary
| Measurement | Norwegian | European |
| Minimum | 0.38% | 0.65% |
| Maximum | 5.6% | 32.8% |
| Range | 5.2% | 32.2% |
| Mean | 2.6% | 7.0% |
| Median | 2.3% | 4.5% |
| Interquartile 25% (IQ1) | 1.5% | 2.8% |
| Interquartile 75% (IQ3) | 3.7% | 6.0% |
| Interquartile Range (IQR) | 2.2% | 3.2% |
| Standard Deviation (Sample) | 1.3% | 7.4% |
| Standard Deviation (Population) | 1.3% | 7.3% |
Similar Demographics by Professional Degree
Demographics Similar to Norwegians by Professional Degree
In terms of professional degree, the demographic groups most similar to Norwegians are Immigrants from North Macedonia (4.2%, a difference of 0.080%), Immigrants from Middle Africa (4.2%, a difference of 0.37%), Czechoslovakian (4.2%, a difference of 0.42%), Finnish (4.2%, a difference of 0.44%), and Spanish (4.2%, a difference of 0.56%).
| Demographics | Rating | Rank | Professional Degree |
| Ghanaians | 27.3 /100 | #192 | Fair 4.3% |
| French | 27.1 /100 | #193 | Fair 4.2% |
| Scandinavians | 25.8 /100 | #194 | Fair 4.2% |
| Nigerians | 24.6 /100 | #195 | Fair 4.2% |
| Spanish | 23.0 /100 | #196 | Fair 4.2% |
| Czechoslovakians | 22.4 /100 | #197 | Fair 4.2% |
| Immigrants | Middle Africa | 22.1 /100 | #198 | Fair 4.2% |
| Norwegians | 20.5 /100 | #199 | Fair 4.2% |
| Immigrants | North Macedonia | 20.2 /100 | #200 | Fair 4.2% |
| Finns | 18.7 /100 | #201 | Poor 4.2% |
| Immigrants | Iraq | 17.1 /100 | #202 | Poor 4.2% |
| Panamanians | 15.9 /100 | #203 | Poor 4.1% |
| Barbadians | 15.8 /100 | #204 | Poor 4.1% |
| Somalis | 14.8 /100 | #205 | Poor 4.1% |
| Yugoslavians | 13.4 /100 | #206 | Poor 4.1% |
Demographics Similar to Europeans by Professional Degree
In terms of professional degree, the demographic groups most similar to Europeans are Immigrants from Albania (4.8%, a difference of 0.050%), Immigrants from Eritrea (4.8%, a difference of 0.17%), Serbian (4.8%, a difference of 0.30%), Immigrants from Eastern Africa (4.8%, a difference of 0.32%), and Immigrants from Venezuela (4.8%, a difference of 0.36%).
| Demographics | Rating | Rank | Professional Degree |
| Immigrants | Sudan | 95.4 /100 | #119 | Exceptional 4.9% |
| Albanians | 95.3 /100 | #120 | Exceptional 4.9% |
| Immigrants | Moldova | 94.8 /100 | #121 | Exceptional 4.9% |
| Immigrants | Germany | 94.1 /100 | #122 | Exceptional 4.9% |
| Immigrants | Venezuela | 93.8 /100 | #123 | Exceptional 4.8% |
| Immigrants | Eritrea | 93.5 /100 | #124 | Exceptional 4.8% |
| Immigrants | Albania | 93.3 /100 | #125 | Exceptional 4.8% |
| Europeans | 93.2 /100 | #126 | Exceptional 4.8% |
| Serbians | 92.6 /100 | #127 | Exceptional 4.8% |
| Immigrants | Eastern Africa | 92.5 /100 | #128 | Exceptional 4.8% |
| Palestinians | 91.5 /100 | #129 | Exceptional 4.8% |
| Icelanders | 91.5 /100 | #130 | Exceptional 4.8% |
| Immigrants | Nepal | 91.4 /100 | #131 | Exceptional 4.8% |
| Pakistanis | 90.9 /100 | #132 | Exceptional 4.8% |
| Italians | 90.2 /100 | #133 | Exceptional 4.8% |