Norwegian vs European High School Diploma
COMPARE
Norwegian
European
High School Diploma
High School Diploma Comparison
Norwegians
Europeans
92.5%
HIGH SCHOOL DIPLOMA
100.0/ 100
METRIC RATING
1st/ 347
METRIC RANK
91.4%
HIGH SCHOOL DIPLOMA
99.9/ 100
METRIC RATING
29th/ 347
METRIC RANK
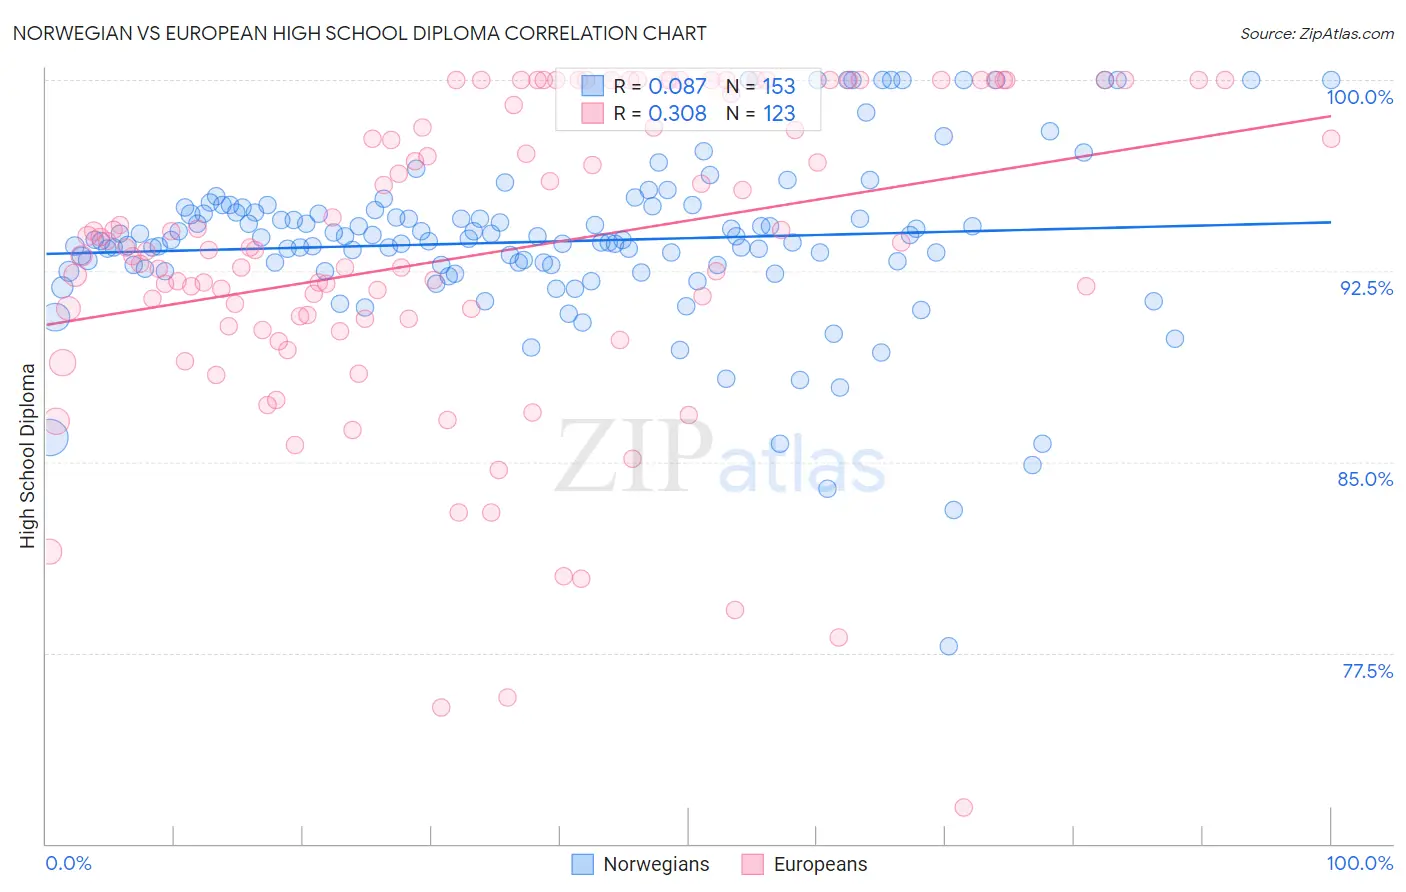
Norwegian vs European High School Diploma Correlation Chart
The statistical analysis conducted on geographies consisting of 533,395,571 people shows a slight positive correlation between the proportion of Norwegians and percentage of population with at least high school diploma education in the United States with a correlation coefficient (R) of 0.087 and weighted average of 92.5%. Similarly, the statistical analysis conducted on geographies consisting of 561,829,322 people shows a mild positive correlation between the proportion of Europeans and percentage of population with at least high school diploma education in the United States with a correlation coefficient (R) of 0.308 and weighted average of 91.4%, a difference of 1.2%.
High School Diploma Correlation Summary
| Measurement | Norwegian | European |
| Minimum | 77.8% | 71.4% |
| Maximum | 100.0% | 100.0% |
| Range | 22.2% | 28.6% |
| Mean | 93.7% | 93.2% |
| Median | 93.7% | 93.3% |
| Interquartile 25% (IQ1) | 92.7% | 90.6% |
| Interquartile 75% (IQ3) | 94.9% | 99.5% |
| Interquartile Range (IQR) | 2.2% | 8.9% |
| Standard Deviation (Sample) | 3.3% | 6.1% |
| Standard Deviation (Population) | 3.3% | 6.1% |
Similar Demographics by High School Diploma
Demographics Similar to Norwegians by High School Diploma
In terms of high school diploma, the demographic groups most similar to Norwegians are Swedish (92.2%, a difference of 0.33%), Carpatho Rusyn (92.1%, a difference of 0.43%), Lithuanian (92.0%, a difference of 0.49%), Slovene (92.0%, a difference of 0.49%), and Slovak (92.0%, a difference of 0.51%).
| Demographics | Rating | Rank | High School Diploma |
| Norwegians | 100.0 /100 | #1 | Exceptional 92.5% |
| Swedes | 100.0 /100 | #2 | Exceptional 92.2% |
| Carpatho Rusyns | 100.0 /100 | #3 | Exceptional 92.1% |
| Lithuanians | 100.0 /100 | #4 | Exceptional 92.0% |
| Slovenes | 100.0 /100 | #5 | Exceptional 92.0% |
| Slovaks | 100.0 /100 | #6 | Exceptional 92.0% |
| Immigrants | India | 100.0 /100 | #7 | Exceptional 92.0% |
| Chinese | 100.0 /100 | #8 | Exceptional 92.0% |
| Latvians | 100.0 /100 | #9 | Exceptional 92.0% |
| Croatians | 100.0 /100 | #10 | Exceptional 92.0% |
| Eastern Europeans | 100.0 /100 | #11 | Exceptional 91.9% |
| Poles | 100.0 /100 | #12 | Exceptional 91.9% |
| Danes | 100.0 /100 | #13 | Exceptional 91.8% |
| Bulgarians | 100.0 /100 | #14 | Exceptional 91.8% |
| Luxembourgers | 100.0 /100 | #15 | Exceptional 91.7% |
Demographics Similar to Europeans by High School Diploma
In terms of high school diploma, the demographic groups most similar to Europeans are Iranian (91.4%, a difference of 0.010%), Immigrants from Northern Europe (91.4%, a difference of 0.010%), Tlingit-Haida (91.4%, a difference of 0.020%), English (91.4%, a difference of 0.020%), and Okinawan (91.4%, a difference of 0.020%).
| Demographics | Rating | Rank | High School Diploma |
| Estonians | 99.9 /100 | #22 | Exceptional 91.6% |
| Scandinavians | 99.9 /100 | #23 | Exceptional 91.5% |
| Italians | 99.9 /100 | #24 | Exceptional 91.5% |
| Thais | 99.9 /100 | #25 | Exceptional 91.5% |
| Russians | 99.9 /100 | #26 | Exceptional 91.5% |
| Cypriots | 99.9 /100 | #27 | Exceptional 91.5% |
| Tlingit-Haida | 99.9 /100 | #28 | Exceptional 91.4% |
| Europeans | 99.9 /100 | #29 | Exceptional 91.4% |
| Iranians | 99.9 /100 | #30 | Exceptional 91.4% |
| Immigrants | Northern Europe | 99.9 /100 | #31 | Exceptional 91.4% |
| English | 99.9 /100 | #32 | Exceptional 91.4% |
| Okinawans | 99.9 /100 | #33 | Exceptional 91.4% |
| Scottish | 99.9 /100 | #34 | Exceptional 91.4% |
| Irish | 99.9 /100 | #35 | Exceptional 91.4% |
| Tsimshian | 99.9 /100 | #36 | Exceptional 91.3% |