Nonimmigrants vs West Indian 9th Grade
COMPARE
Nonimmigrants
West Indian
9th Grade
9th Grade Comparison
Nonimmigrants
West Indians
95.3%
9TH GRADE
92.0/ 100
METRIC RATING
132nd/ 347
METRIC RANK
93.7%
9TH GRADE
0.2/ 100
METRIC RATING
276th/ 347
METRIC RANK
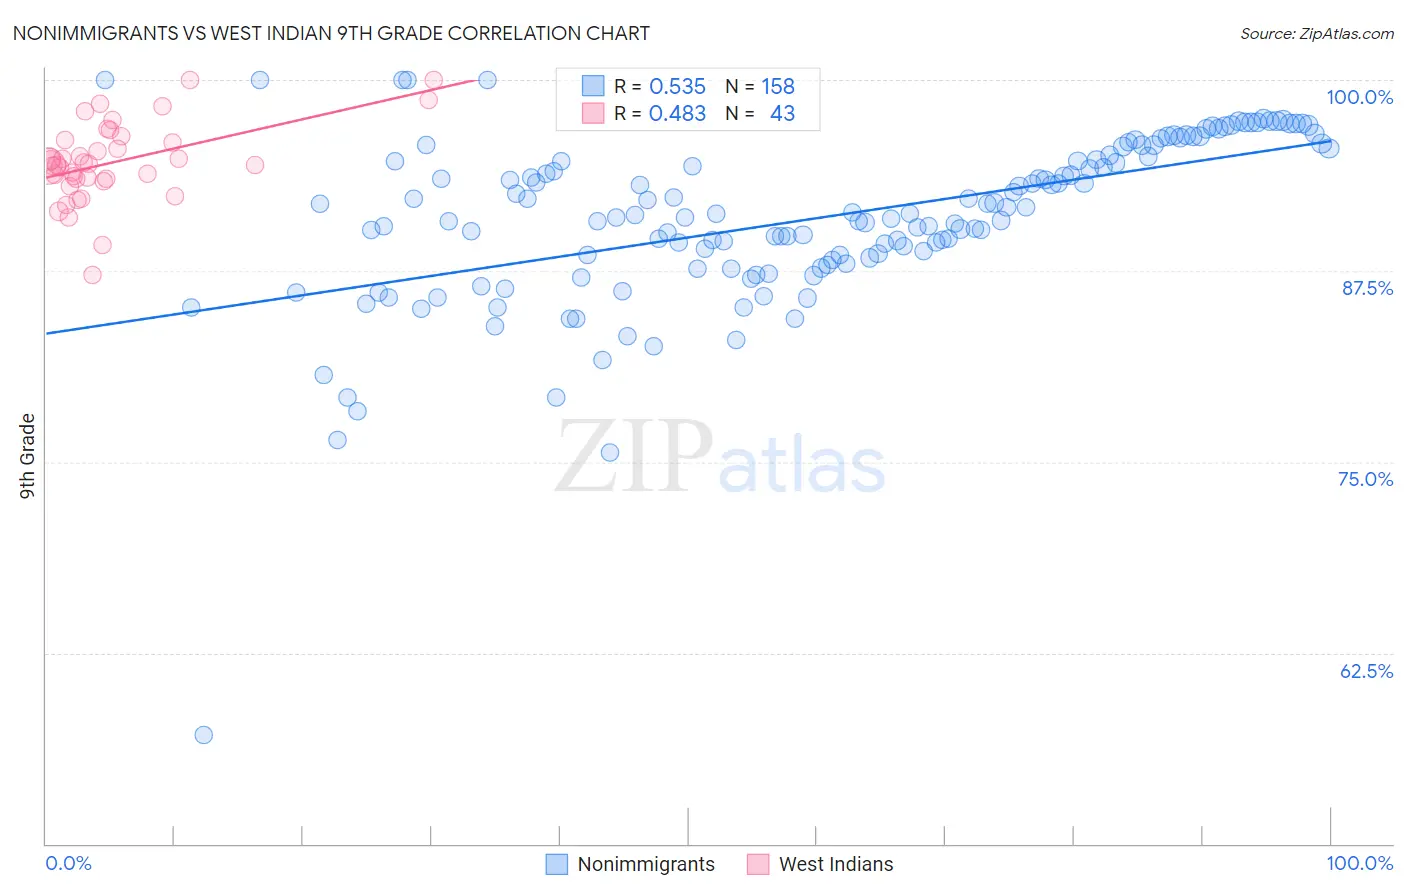
Nonimmigrants vs West Indian 9th Grade Correlation Chart
The statistical analysis conducted on geographies consisting of 585,372,544 people shows a substantial positive correlation between the proportion of Nonimmigrants and percentage of population with at least 9th grade education in the United States with a correlation coefficient (R) of 0.535 and weighted average of 95.3%. Similarly, the statistical analysis conducted on geographies consisting of 254,059,006 people shows a moderate positive correlation between the proportion of West Indians and percentage of population with at least 9th grade education in the United States with a correlation coefficient (R) of 0.483 and weighted average of 93.7%, a difference of 1.7%.
9th Grade Correlation Summary
| Measurement | Nonimmigrants | West Indian |
| Minimum | 57.2% | 87.3% |
| Maximum | 100.0% | 100.0% |
| Range | 42.8% | 12.7% |
| Mean | 91.0% | 94.6% |
| Median | 91.2% | 94.5% |
| Interquartile 25% (IQ1) | 88.2% | 93.5% |
| Interquartile 75% (IQ3) | 95.0% | 96.1% |
| Interquartile Range (IQR) | 6.8% | 2.5% |
| Standard Deviation (Sample) | 5.6% | 2.6% |
| Standard Deviation (Population) | 5.6% | 2.6% |
Similar Demographics by 9th Grade
Demographics Similar to Nonimmigrants by 9th Grade
In terms of 9th grade, the demographic groups most similar to Nonimmigrants are Immigrants from North Macedonia (95.3%, a difference of 0.010%), Israeli (95.3%, a difference of 0.030%), Jordanian (95.3%, a difference of 0.040%), Immigrants from Israel (95.3%, a difference of 0.050%), and Immigrants from Hungary (95.4%, a difference of 0.060%).
| Demographics | Rating | Rank | 9th Grade |
| Immigrants | South Central Asia | 95.1 /100 | #125 | Exceptional 95.4% |
| Immigrants | Serbia | 94.4 /100 | #126 | Exceptional 95.4% |
| Palestinians | 94.3 /100 | #127 | Exceptional 95.4% |
| Immigrants | Hungary | 94.2 /100 | #128 | Exceptional 95.4% |
| Basques | 94.1 /100 | #129 | Exceptional 95.4% |
| Jordanians | 93.5 /100 | #130 | Exceptional 95.3% |
| Immigrants | North Macedonia | 92.3 /100 | #131 | Exceptional 95.3% |
| Immigrants | Nonimmigrants | 92.0 /100 | #132 | Exceptional 95.3% |
| Israelis | 90.4 /100 | #133 | Exceptional 95.3% |
| Immigrants | Israel | 89.6 /100 | #134 | Excellent 95.3% |
| Immigrants | Belarus | 88.9 /100 | #135 | Excellent 95.2% |
| Immigrants | Iran | 88.3 /100 | #136 | Excellent 95.2% |
| Hmong | 87.7 /100 | #137 | Excellent 95.2% |
| Immigrants | Russia | 86.6 /100 | #138 | Excellent 95.2% |
| Immigrants | Eastern Europe | 85.8 /100 | #139 | Excellent 95.2% |
Demographics Similar to West Indians by 9th Grade
In terms of 9th grade, the demographic groups most similar to West Indians are Immigrants from Philippines (93.7%, a difference of 0.010%), Immigrants from Eritrea (93.7%, a difference of 0.010%), Immigrants from Colombia (93.8%, a difference of 0.020%), Immigrants from South America (93.8%, a difference of 0.030%), and Peruvian (93.8%, a difference of 0.030%).
| Demographics | Rating | Rank | 9th Grade |
| Immigrants | Uruguay | 0.2 /100 | #269 | Tragic 93.8% |
| Yuman | 0.2 /100 | #270 | Tragic 93.8% |
| Immigrants | Ghana | 0.2 /100 | #271 | Tragic 93.8% |
| Immigrants | Western Africa | 0.2 /100 | #272 | Tragic 93.8% |
| Immigrants | South America | 0.2 /100 | #273 | Tragic 93.8% |
| Peruvians | 0.2 /100 | #274 | Tragic 93.8% |
| Immigrants | Colombia | 0.2 /100 | #275 | Tragic 93.8% |
| West Indians | 0.2 /100 | #276 | Tragic 93.7% |
| Immigrants | Philippines | 0.1 /100 | #277 | Tragic 93.7% |
| Immigrants | Eritrea | 0.1 /100 | #278 | Tragic 93.7% |
| Trinidadians and Tobagonians | 0.1 /100 | #279 | Tragic 93.7% |
| Taiwanese | 0.1 /100 | #280 | Tragic 93.6% |
| Immigrants | Trinidad and Tobago | 0.1 /100 | #281 | Tragic 93.6% |
| Malaysians | 0.0 /100 | #282 | Tragic 93.5% |
| Barbadians | 0.0 /100 | #283 | Tragic 93.5% |