Nonimmigrants vs Immigrants from Grenada Householder Income Ages 25 - 44 years
COMPARE
Nonimmigrants
Immigrants from Grenada
Householder Income Ages 25 - 44 years
Householder Income Ages 25 - 44 years Comparison
Nonimmigrants
Immigrants from Grenada
$88,301
HOUSEHOLDER INCOME AGES 25 - 44 YEARS
3.0/ 100
METRIC RATING
232nd/ 347
METRIC RANK
$88,311
HOUSEHOLDER INCOME AGES 25 - 44 YEARS
3.0/ 100
METRIC RATING
231st/ 347
METRIC RANK
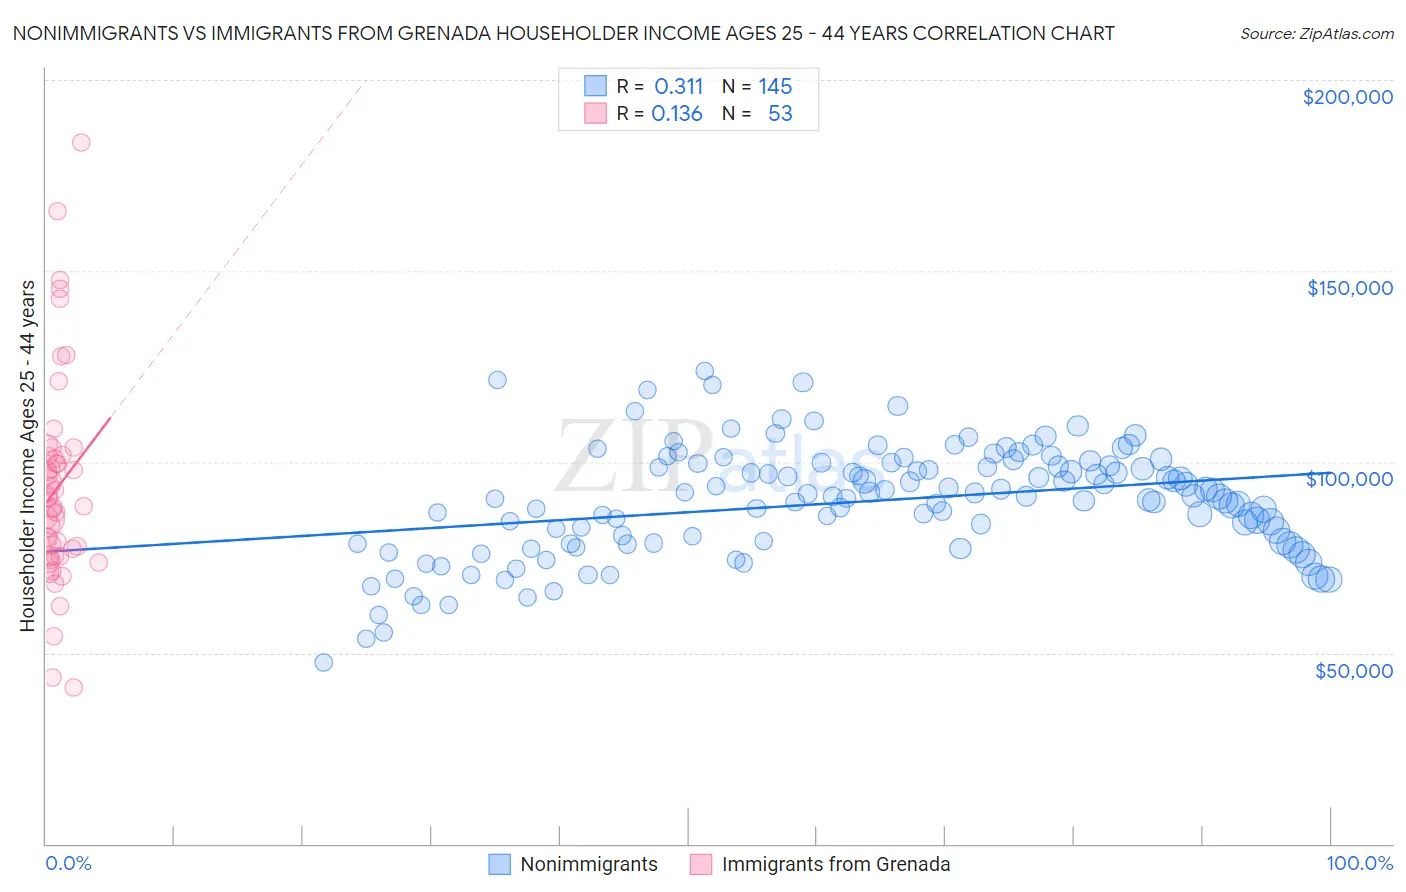
Nonimmigrants vs Immigrants from Grenada Householder Income Ages 25 - 44 years Correlation Chart
The statistical analysis conducted on geographies consisting of 576,019,560 people shows a mild positive correlation between the proportion of Nonimmigrants and household income with householder between the ages 25 and 44 in the United States with a correlation coefficient (R) of 0.311 and weighted average of $88,301. Similarly, the statistical analysis conducted on geographies consisting of 67,165,379 people shows a poor positive correlation between the proportion of Immigrants from Grenada and household income with householder between the ages 25 and 44 in the United States with a correlation coefficient (R) of 0.136 and weighted average of $88,311, a difference of 0.010%.
Householder Income Ages 25 - 44 years Correlation Summary
| Measurement | Nonimmigrants | Immigrants from Grenada |
| Minimum | $47,510 | $40,942 |
| Maximum | $123,721 | $183,750 |
| Range | $76,211 | $142,808 |
| Mean | $89,568 | $93,291 |
| Median | $91,026 | $88,464 |
| Interquartile 25% (IQ1) | $78,698 | $75,281 |
| Interquartile 75% (IQ3) | $99,239 | $101,579 |
| Interquartile Range (IQR) | $20,541 | $26,298 |
| Standard Deviation (Sample) | $14,473 | $27,452 |
| Standard Deviation (Population) | $14,423 | $27,192 |
Demographics Similar to Nonimmigrants and Immigrants from Grenada by Householder Income Ages 25 - 44 years
In terms of householder income ages 25 - 44 years, the demographic groups most similar to Nonimmigrants are Malaysian ($88,291, a difference of 0.010%), Venezuelan ($88,232, a difference of 0.080%), Bermudan ($88,231, a difference of 0.080%), Immigrants from Cameroon ($88,214, a difference of 0.10%), and Salvadoran ($88,198, a difference of 0.12%). Similarly, the demographic groups most similar to Immigrants from Grenada are Malaysian ($88,291, a difference of 0.020%), Venezuelan ($88,232, a difference of 0.090%), Bermudan ($88,231, a difference of 0.090%), Immigrants from Cameroon ($88,214, a difference of 0.11%), and Salvadoran ($88,198, a difference of 0.13%).
| Demographics | Rating | Rank | Householder Income Ages 25 - 44 years |
| Immigrants | Trinidad and Tobago | 6.5 /100 | #221 | Tragic $89,748 |
| Immigrants | Ecuador | 6.2 /100 | #222 | Tragic $89,673 |
| Immigrants | Guyana | 5.9 /100 | #223 | Tragic $89,586 |
| Barbadians | 5.9 /100 | #224 | Tragic $89,565 |
| Immigrants | Panama | 5.5 /100 | #225 | Tragic $89,451 |
| Immigrants | Iraq | 5.5 /100 | #226 | Tragic $89,444 |
| Immigrants | St. Vincent and the Grenadines | 4.1 /100 | #227 | Tragic $88,888 |
| Immigrants | Bosnia and Herzegovina | 4.0 /100 | #228 | Tragic $88,819 |
| Immigrants | Barbados | 3.7 /100 | #229 | Tragic $88,687 |
| Alaskan Athabascans | 3.3 /100 | #230 | Tragic $88,446 |
| Immigrants | Grenada | 3.0 /100 | #231 | Tragic $88,311 |
| Immigrants | Nonimmigrants | 3.0 /100 | #232 | Tragic $88,301 |
| Malaysians | 3.0 /100 | #233 | Tragic $88,291 |
| Venezuelans | 2.9 /100 | #234 | Tragic $88,232 |
| Bermudans | 2.9 /100 | #235 | Tragic $88,231 |
| Immigrants | Cameroon | 2.9 /100 | #236 | Tragic $88,214 |
| Salvadorans | 2.8 /100 | #237 | Tragic $88,198 |
| Alaska Natives | 2.6 /100 | #238 | Tragic $88,018 |
| Immigrants | Ghana | 2.2 /100 | #239 | Tragic $87,760 |
| Nicaraguans | 2.2 /100 | #240 | Tragic $87,751 |
| Nigerians | 2.2 /100 | #241 | Tragic $87,730 |