Immigrants from Italy vs Immigrants from Croatia Median Female Earnings

COMPARE

Immigrants from Italy
Race
Ancestry
AfghanAfricanAlaska NativeAlaskan AthabascanAlbanianAleutAlsatianAmericanApacheArabArapahoArgentineanArmenianAssyrian/Chaldean/SyriacAustralianAustrianBahamianBangladeshiBarbadianBasqueBelgianBelizeanBermudanBhutaneseBlackfeetBolivianBrazilianBritishBritish West IndianBulgarianBurmeseCajunCambodianCanadianCape VerdeanCarpatho RusynCelticCentral AmericanCentral American IndianCherokeeCheyenneChickasawChileanChineseChippewaChoctawColombianColvilleComancheCosta RicanCreeCreekCroatianCrowCubanCypriotCzechCzechoslovakianDanishDelawareDominicanDutchDutch West IndianEastern EuropeanEcuadorianEgyptianEnglishEstonianEthiopianEuropeanFijianFilipinoFinnishFrenchFrench American IndianFrench CanadianGermanGerman RussianGhanaianGreekGuamanian/ChamorroGuatemalanGuyaneseHaitianHmongHonduranHopiHoumaHungarianIcelanderIndian (Asian)IndonesianInupiatIranianIraqiIrishIroquoisIsraeliItalianJamaicanJapaneseJordanianKenyanKiowaKoreanLaotianLatvianLebaneseLiberianLithuanianLumbeeLuxembourgerMacedonianMalaysianMalteseMarshalleseMenomineeMexicanMexican American IndianMongolianMoroccanNative HawaiianNavajoNepaleseNew ZealanderNicaraguanNigerianNorthern EuropeanNorwegianOkinawanOsageOttawaPaiutePakistaniPalestinianPanamanianParaguayanPennsylvania GermanPeruvianPimaPolishPortuguesePotawatomiPuebloPuerto RicanPuget Sound SalishRomanianRussianSalvadoranSamoanScandinavianScotch-IrishScottishSeminoleSenegaleseSerbianShoshoneSierra LeoneanSiouxSlavicSlovakSloveneSomaliSouth AfricanSouth AmericanSouth American IndianSoviet UnionSpaniardSpanishSpanish AmericanSpanish American IndianSri LankanSubsaharan AfricanSudaneseSwedishSwissSyrianTaiwaneseThaiTlingit-HaidaTohono O'OdhamTonganTrinidadian and TobagonianTsimshianTurkishU.S. Virgin IslanderUgandanUkrainianUruguayanUteVenezuelanVietnameseWelshWest IndianYakamaYaquiYugoslavianYumanYup'ikZimbabwean
Immigration
NonimmigrantsImmigrantsAfghanistanAfricaAlbaniaArgentinaArmeniaAsiaAustraliaAustriaBahamasBangladeshBarbadosBelarusBelgiumBelizeBoliviaBosnia and HerzegovinaBrazilBulgariaBurma/MyanmarCabo VerdeCambodiaCameroonCanadaCaribbeanCentral AmericaChileChinaColombiaCongoCosta RicaCubaCzechoslovakiaDenmarkDominicaDominican RepublicEastern AfricaEastern AsiaEastern EuropeEcuadorEgyptEl SalvadorEnglandEritreaEthiopiaEuropeFijiFranceGermanyGhanaGreeceGrenadaGuatemalaGuyanaHaitiHondurasHong KongHungaryIndiaIndonesiaIranIraqIrelandIsraelItalyJamaicaJapanJordanKazakhstanKenyaKoreaKuwaitLaosLatin AmericaLatviaLebanonLiberiaLithuaniaMalaysiaMexicoMicronesiaMiddle AfricaMoldovaMoroccoNepalNetherlandsNicaraguaNigeriaNorth AmericaNorth MacedoniaNorthern AfricaNorthern EuropeNorwayOceaniaPakistanPanamaPeruPhilippinesPolandPortugalRomaniaRussiaSaudi ArabiaScotlandSenegalSerbiaSierra LeoneSingaporeSomaliaSouth AfricaSouth AmericaSouth Central AsiaSouth Eastern AsiaSouthern EuropeSpainSri LankaSt. Vincent and the GrenadinesSudanSwedenSwitzerlandSyriaTaiwanThailandTrinidad and TobagoTurkeyUgandaUkraineUruguayUzbekistanVenezuelaVietnamWest IndiesWestern AfricaWestern AsiaWestern EuropeYemenZaireZimbabweAzores
Immigrants from Croatia
Race
Ancestry
AfghanAfricanAlaska NativeAlaskan AthabascanAlbanianAleutAlsatianAmericanApacheArabArapahoArgentineanArmenianAssyrian/Chaldean/SyriacAustralianAustrianBahamianBangladeshiBarbadianBasqueBelgianBelizeanBermudanBhutaneseBlackfeetBolivianBrazilianBritishBritish West IndianBulgarianBurmeseCajunCambodianCanadianCape VerdeanCarpatho RusynCelticCentral AmericanCentral American IndianCherokeeCheyenneChickasawChileanChineseChippewaChoctawColombianColvilleComancheCosta RicanCreeCreekCroatianCrowCubanCypriotCzechCzechoslovakianDanishDelawareDominicanDutchDutch West IndianEastern EuropeanEcuadorianEgyptianEnglishEstonianEthiopianEuropeanFijianFilipinoFinnishFrenchFrench American IndianFrench CanadianGermanGerman RussianGhanaianGreekGuamanian/ChamorroGuatemalanGuyaneseHaitianHmongHonduranHopiHoumaHungarianIcelanderIndian (Asian)IndonesianInupiatIranianIraqiIrishIroquoisIsraeliItalianJamaicanJapaneseJordanianKenyanKiowaKoreanLaotianLatvianLebaneseLiberianLithuanianLumbeeLuxembourgerMacedonianMalaysianMalteseMarshalleseMenomineeMexicanMexican American IndianMongolianMoroccanNative HawaiianNavajoNepaleseNew ZealanderNicaraguanNigerianNorthern EuropeanNorwegianOkinawanOsageOttawaPaiutePakistaniPalestinianPanamanianParaguayanPennsylvania GermanPeruvianPimaPolishPortuguesePotawatomiPuebloPuerto RicanPuget Sound SalishRomanianRussianSalvadoranSamoanScandinavianScotch-IrishScottishSeminoleSenegaleseSerbianShoshoneSierra LeoneanSiouxSlavicSlovakSloveneSomaliSouth AfricanSouth AmericanSouth American IndianSoviet UnionSpaniardSpanishSpanish AmericanSpanish American IndianSri LankanSubsaharan AfricanSudaneseSwedishSwissSyrianTaiwaneseThaiTlingit-HaidaTohono O'OdhamTonganTrinidadian and TobagonianTsimshianTurkishU.S. Virgin IslanderUgandanUkrainianUruguayanUteVenezuelanVietnameseWelshWest IndianYakamaYaquiYugoslavianYumanYup'ikZimbabwean
Immigration
NonimmigrantsImmigrantsAfghanistanAfricaAlbaniaArgentinaArmeniaAsiaAustraliaAustriaBahamasBangladeshBarbadosBelarusBelgiumBelizeBoliviaBosnia and HerzegovinaBrazilBulgariaBurma/MyanmarCabo VerdeCambodiaCameroonCanadaCaribbeanCentral AmericaChileChinaColombiaCongoCosta RicaCroatiaCubaCzechoslovakiaDenmarkDominicaDominican RepublicEastern AfricaEastern AsiaEastern EuropeEcuadorEgyptEl SalvadorEnglandEritreaEthiopiaEuropeFijiFranceGermanyGhanaGreeceGrenadaGuatemalaGuyanaHaitiHondurasHong KongHungaryIndiaIndonesiaIranIraqIrelandIsraelJamaicaJapanJordanKazakhstanKenyaKoreaKuwaitLaosLatin AmericaLatviaLebanonLiberiaLithuaniaMalaysiaMexicoMicronesiaMiddle AfricaMoldovaMoroccoNepalNetherlandsNicaraguaNigeriaNorth AmericaNorth MacedoniaNorthern AfricaNorthern EuropeNorwayOceaniaPakistanPanamaPeruPhilippinesPolandPortugalRomaniaRussiaSaudi ArabiaScotlandSenegalSerbiaSierra LeoneSingaporeSomaliaSouth AfricaSouth AmericaSouth Central AsiaSouth Eastern AsiaSouthern EuropeSpainSri LankaSt. Vincent and the GrenadinesSudanSwedenSwitzerlandSyriaTaiwanThailandTrinidad and TobagoTurkeyUgandaUkraineUruguayUzbekistanVenezuelaVietnamWest IndiesWestern AfricaWestern AsiaWestern EuropeYemenZaireZimbabweAzores
Median Female Earnings
Income
Poverty
Unemployment
Labor Participation
Family Structure
Vehicle Availability
Education Level
Disability

Median Female Earnings Comparison

Immigrants from Italy

Immigrants from Croatia

Exceptional
Exceptional
$42,446
MEDIAN FEMALE EARNINGS
99.7/ 100
METRIC RATING
76th/ 347
METRIC RANK
$43,258
MEDIAN FEMALE EARNINGS
99.9/ 100
METRIC RATING
56th/ 347
METRIC RANK

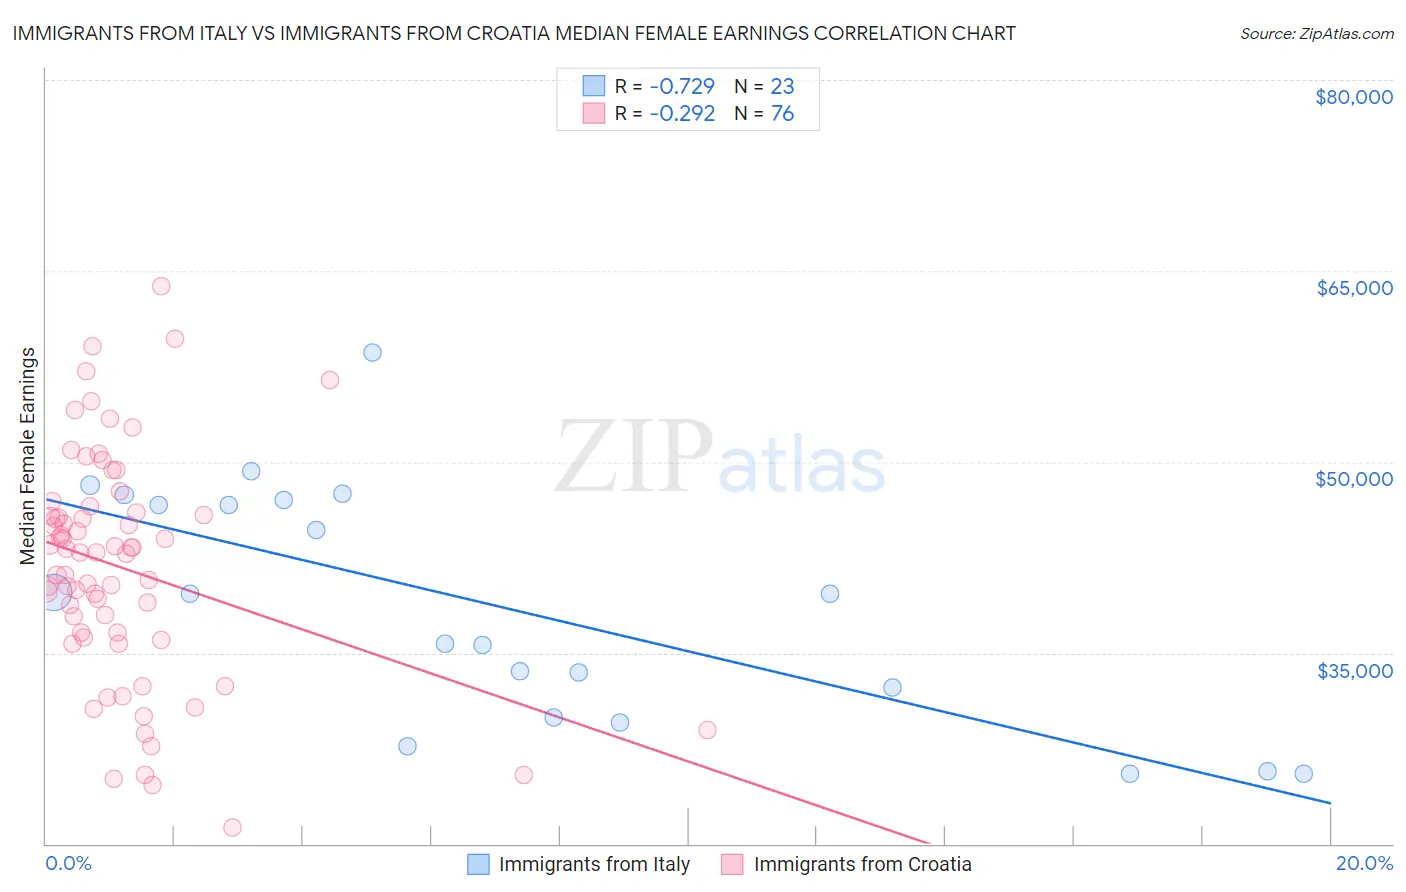
Immigrants from Italy vs Immigrants from Croatia Median Female Earnings Correlation Chart

The statistical analysis conducted on geographies consisting of 324,085,917 people shows a strong negative correlation between the proportion of Immigrants from Italy and median female earnings in the United States with a correlation coefficient (R) of -0.729 and weighted average of $42,446. Similarly, the statistical analysis conducted on geographies consisting of 132,568,368 people shows a weak negative correlation between the proportion of Immigrants from Croatia and median female earnings in the United States with a correlation coefficient (R) of -0.292 and weighted average of $43,258, a difference of 1.9%.
Immigrants from Italy vs Immigrants from Croatia Median Female Earnings

Median Female Earnings Correlation Summary

MeasurementImmigrants from ItalyImmigrants from Croatia
Minimum$25,509$21,250
Maximum$58,594$63,753
Range$33,085$42,503
Mean$38,670$41,680
Median$39,639$42,916
Interquartile 25% (IQ1)$29,886$36,403
Interquartile 75% (IQ3)$47,033$45,910
Interquartile Range (IQR)$17,147$9,507
Standard Deviation (Sample)$9,280$8,879
Standard Deviation (Population)$9,076$8,820

Demographics Similar to Immigrants from Italy and Immigrants from Croatia by Median Female Earnings

In terms of median female earnings, the demographic groups most similar to Immigrants from Italy are New Zealander ($42,446, a difference of 0.0%), Immigrants from South Africa ($42,508, a difference of 0.15%), Mongolian ($42,542, a difference of 0.23%), Albanian ($42,584, a difference of 0.33%), and Immigrants from Romania ($42,718, a difference of 0.64%). Similarly, the demographic groups most similar to Immigrants from Croatia are Ethiopian ($43,243, a difference of 0.040%), Paraguayan ($43,173, a difference of 0.20%), Estonian ($43,106, a difference of 0.35%), Immigrants from Latvia ($43,099, a difference of 0.37%), and Immigrants from Bulgaria ($43,085, a difference of 0.40%).
DemographicsRating | RankMedian Female Earnings
Immigrants | Croatia
99.9
/100
|
#56
Exceptional
$43,258
Ethiopians
99.9
/100
|
#57
Exceptional
$43,243
Paraguayans
99.9
/100
|
#58
Exceptional
$43,173
Estonians
99.9
/100
|
#59
Exceptional
$43,106
Immigrants | Latvia
99.9
/100
|
#60
Exceptional
$43,099
Immigrants | Bulgaria
99.9
/100
|
#61
Exceptional
$43,085
Afghans
99.9
/100
|
#62
Exceptional
$43,077
Immigrants | Ukraine
99.9
/100
|
#63
Exceptional
$43,069
Immigrants | Pakistan
99.9
/100
|
#64
Exceptional
$43,052
Sierra Leoneans
99.9
/100
|
#65
Exceptional
$42,868
Immigrants | Norway
99.9
/100
|
#66
Exceptional
$42,837
Immigrants | Egypt
99.9
/100
|
#67
Exceptional
$42,837
Immigrants | Austria
99.8
/100
|
#68
Exceptional
$42,824
Immigrants | Spain
99.8
/100
|
#69
Exceptional
$42,815
Immigrants | Ethiopia
99.8
/100
|
#70
Exceptional
$42,744
Immigrants | Romania
99.8
/100
|
#71
Exceptional
$42,718
Albanians
99.8
/100
|
#72
Exceptional
$42,584
Mongolians
99.7
/100
|
#73
Exceptional
$42,542
Immigrants | South Africa
99.7
/100
|
#74
Exceptional
$42,508
New Zealanders
99.7
/100
|
#75
Exceptional
$42,446
Immigrants | Italy
99.7
/100
|
#76
Exceptional
$42,446