Comanche vs Finnish Median Household Income
COMPARE
Comanche
Finnish
Median Household Income
Median Household Income Comparison
Comanche
Finns
$73,747
MEDIAN HOUSEHOLD INCOME
0.1/ 100
METRIC RATING
292nd/ 347
METRIC RANK
$83,607
MEDIAN HOUSEHOLD INCOME
27.7/ 100
METRIC RATING
193rd/ 347
METRIC RANK
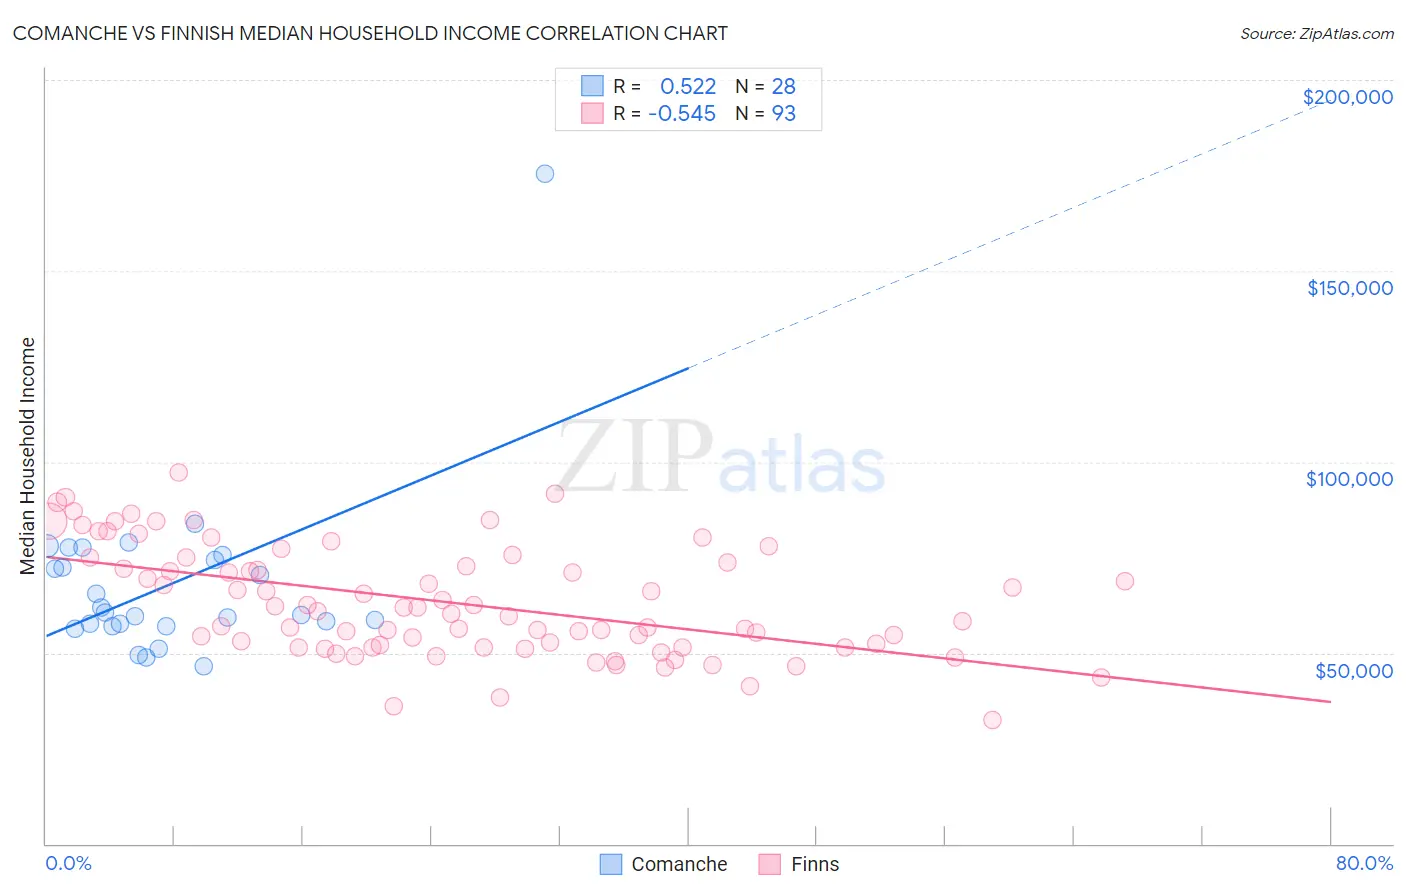
Comanche vs Finnish Median Household Income Correlation Chart
The statistical analysis conducted on geographies consisting of 109,755,043 people shows a substantial positive correlation between the proportion of Comanche and median household income in the United States with a correlation coefficient (R) of 0.522 and weighted average of $73,747. Similarly, the statistical analysis conducted on geographies consisting of 404,464,617 people shows a substantial negative correlation between the proportion of Finns and median household income in the United States with a correlation coefficient (R) of -0.545 and weighted average of $83,607, a difference of 13.4%.
Median Household Income Correlation Summary
| Measurement | Comanche | Finnish |
| Minimum | $46,632 | $32,321 |
| Maximum | $175,595 | $97,373 |
| Range | $128,963 | $65,052 |
| Mean | $67,911 | $63,204 |
| Median | $60,223 | $61,019 |
| Interquartile 25% (IQ1) | $57,248 | $51,350 |
| Interquartile 75% (IQ3) | $74,998 | $74,285 |
| Interquartile Range (IQR) | $17,750 | $22,935 |
| Standard Deviation (Sample) | $23,505 | $14,392 |
| Standard Deviation (Population) | $23,081 | $14,315 |
Similar Demographics by Median Household Income
Demographics Similar to Comanche by Median Household Income
In terms of median household income, the demographic groups most similar to Comanche are Hispanic or Latino ($73,823, a difference of 0.10%), Immigrants from Cabo Verde ($73,515, a difference of 0.31%), Blackfeet ($73,509, a difference of 0.32%), Cuban ($73,392, a difference of 0.48%), and Bangladeshi ($74,112, a difference of 0.50%).
| Demographics | Rating | Rank | Median Household Income |
| Mexicans | 0.1 /100 | #285 | Tragic $74,399 |
| Immigrants | Somalia | 0.1 /100 | #286 | Tragic $74,300 |
| Iroquois | 0.1 /100 | #287 | Tragic $74,279 |
| Immigrants | Central America | 0.1 /100 | #288 | Tragic $74,217 |
| Fijians | 0.1 /100 | #289 | Tragic $74,205 |
| Bangladeshis | 0.1 /100 | #290 | Tragic $74,112 |
| Hispanics or Latinos | 0.1 /100 | #291 | Tragic $73,823 |
| Comanche | 0.1 /100 | #292 | Tragic $73,747 |
| Immigrants | Cabo Verde | 0.1 /100 | #293 | Tragic $73,515 |
| Blackfeet | 0.1 /100 | #294 | Tragic $73,509 |
| Cubans | 0.1 /100 | #295 | Tragic $73,392 |
| Haitians | 0.1 /100 | #296 | Tragic $73,306 |
| Immigrants | Mexico | 0.0 /100 | #297 | Tragic $73,160 |
| Paiute | 0.0 /100 | #298 | Tragic $72,959 |
| Indonesians | 0.0 /100 | #299 | Tragic $72,856 |
Demographics Similar to Finns by Median Household Income
In terms of median household income, the demographic groups most similar to Finns are Welsh ($83,628, a difference of 0.030%), Ghanaian ($83,582, a difference of 0.030%), Immigrants from Armenia ($83,555, a difference of 0.060%), French ($83,468, a difference of 0.17%), and Iraqi ($83,753, a difference of 0.18%).
| Demographics | Rating | Rank | Median Household Income |
| Puget Sound Salish | 33.2 /100 | #186 | Fair $84,011 |
| Belgians | 33.2 /100 | #187 | Fair $84,008 |
| Tlingit-Haida | 32.6 /100 | #188 | Fair $83,968 |
| Immigrants | Colombia | 31.7 /100 | #189 | Fair $83,902 |
| Slovaks | 30.2 /100 | #190 | Fair $83,798 |
| Iraqis | 29.6 /100 | #191 | Fair $83,753 |
| Welsh | 28.0 /100 | #192 | Fair $83,628 |
| Finns | 27.7 /100 | #193 | Fair $83,607 |
| Ghanaians | 27.4 /100 | #194 | Fair $83,582 |
| Immigrants | Armenia | 27.0 /100 | #195 | Fair $83,555 |
| French | 26.0 /100 | #196 | Fair $83,468 |
| Aleuts | 25.7 /100 | #197 | Fair $83,446 |
| Japanese | 25.1 /100 | #198 | Fair $83,395 |
| Germans | 24.6 /100 | #199 | Fair $83,358 |
| Tsimshian | 24.5 /100 | #200 | Fair $83,346 |