German vs Finnish Median Household Income
COMPARE
German
Finnish
Median Household Income
Median Household Income Comparison
Germans
Finns
$83,358
MEDIAN HOUSEHOLD INCOME
24.6/ 100
METRIC RATING
199th/ 347
METRIC RANK
$83,607
MEDIAN HOUSEHOLD INCOME
27.7/ 100
METRIC RATING
193rd/ 347
METRIC RANK
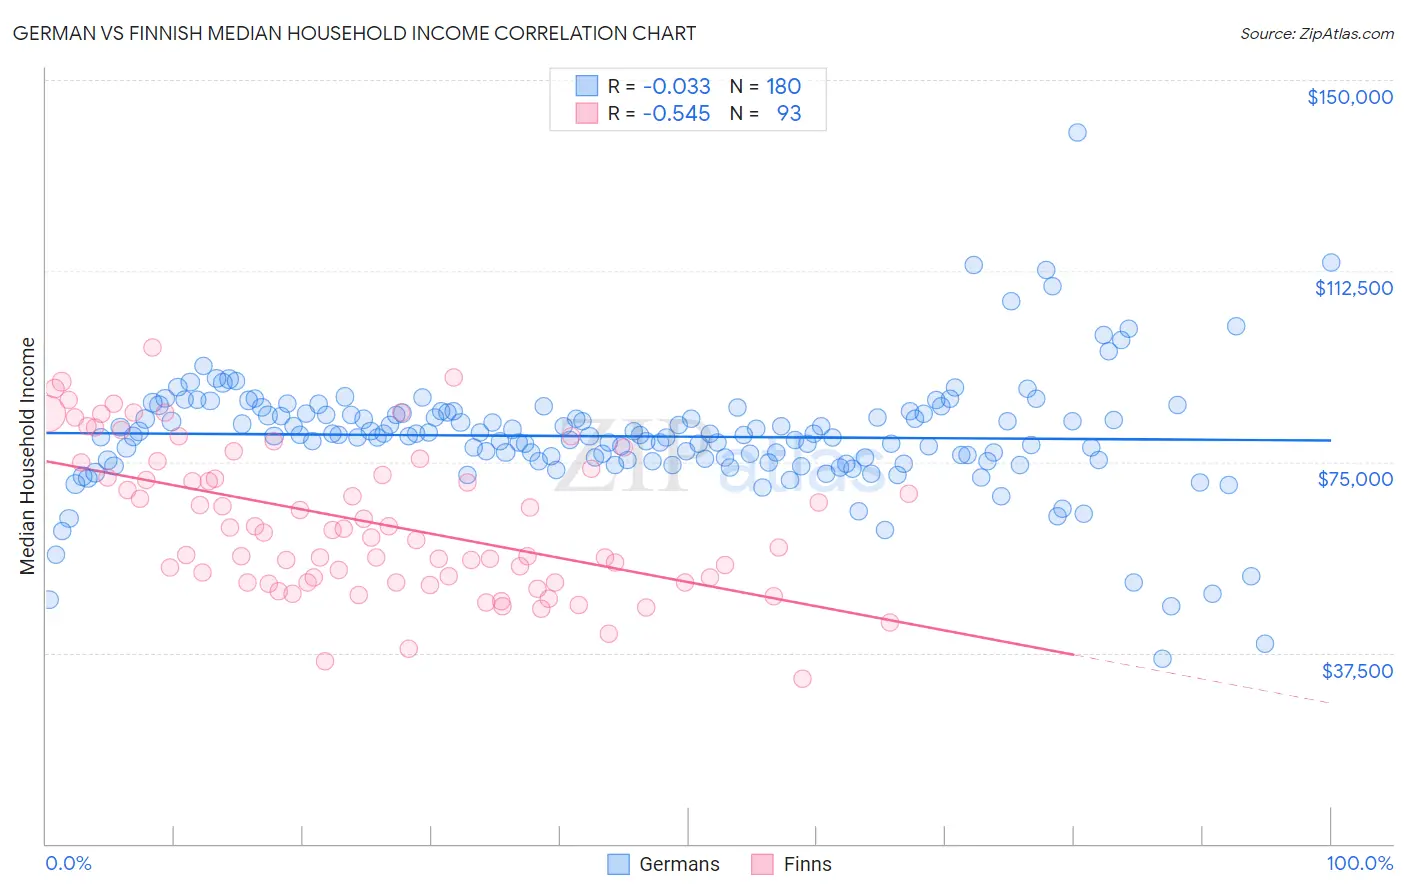
German vs Finnish Median Household Income Correlation Chart
The statistical analysis conducted on geographies consisting of 579,647,874 people shows no correlation between the proportion of Germans and median household income in the United States with a correlation coefficient (R) of -0.033 and weighted average of $83,358. Similarly, the statistical analysis conducted on geographies consisting of 404,464,617 people shows a substantial negative correlation between the proportion of Finns and median household income in the United States with a correlation coefficient (R) of -0.545 and weighted average of $83,607, a difference of 0.30%.
Median Household Income Correlation Summary
| Measurement | German | Finnish |
| Minimum | $36,331 | $32,321 |
| Maximum | $139,709 | $97,373 |
| Range | $103,378 | $65,052 |
| Mean | $80,014 | $63,204 |
| Median | $80,167 | $61,019 |
| Interquartile 25% (IQ1) | $75,354 | $51,350 |
| Interquartile 75% (IQ3) | $84,522 | $74,285 |
| Interquartile Range (IQR) | $9,168 | $22,935 |
| Standard Deviation (Sample) | $11,898 | $14,392 |
| Standard Deviation (Population) | $11,865 | $14,315 |
Demographics Similar to Germans and Finns by Median Household Income
In terms of median household income, the demographic groups most similar to Germans are Tsimshian ($83,346, a difference of 0.010%), Spanish ($83,343, a difference of 0.020%), Japanese ($83,395, a difference of 0.040%), Immigrants from Thailand ($83,327, a difference of 0.040%), and Immigrants from Cambodia ($83,304, a difference of 0.070%). Similarly, the demographic groups most similar to Finns are Welsh ($83,628, a difference of 0.030%), Ghanaian ($83,582, a difference of 0.030%), Immigrants from Armenia ($83,555, a difference of 0.060%), French ($83,468, a difference of 0.17%), and Iraqi ($83,753, a difference of 0.18%).
| Demographics | Rating | Rank | Median Household Income |
| Puget Sound Salish | 33.2 /100 | #186 | Fair $84,011 |
| Belgians | 33.2 /100 | #187 | Fair $84,008 |
| Tlingit-Haida | 32.6 /100 | #188 | Fair $83,968 |
| Immigrants | Colombia | 31.7 /100 | #189 | Fair $83,902 |
| Slovaks | 30.2 /100 | #190 | Fair $83,798 |
| Iraqis | 29.6 /100 | #191 | Fair $83,753 |
| Welsh | 28.0 /100 | #192 | Fair $83,628 |
| Finns | 27.7 /100 | #193 | Fair $83,607 |
| Ghanaians | 27.4 /100 | #194 | Fair $83,582 |
| Immigrants | Armenia | 27.0 /100 | #195 | Fair $83,555 |
| French | 26.0 /100 | #196 | Fair $83,468 |
| Aleuts | 25.7 /100 | #197 | Fair $83,446 |
| Japanese | 25.1 /100 | #198 | Fair $83,395 |
| Germans | 24.6 /100 | #199 | Fair $83,358 |
| Tsimshian | 24.5 /100 | #200 | Fair $83,346 |
| Spanish | 24.4 /100 | #201 | Fair $83,343 |
| Immigrants | Thailand | 24.3 /100 | #202 | Fair $83,327 |
| Immigrants | Cambodia | 24.0 /100 | #203 | Fair $83,304 |
| Immigrants | Africa | 23.8 /100 | #204 | Fair $83,289 |
| Celtics | 22.7 /100 | #205 | Fair $83,193 |
| Immigrants | Kenya | 21.3 /100 | #206 | Fair $83,068 |