Nigerian vs Uruguayan Median Family Income
COMPARE
Nigerian
Uruguayan
Median Family Income
Median Family Income Comparison
Nigerians
Uruguayans
$97,522
MEDIAN FAMILY INCOME
6.7/ 100
METRIC RATING
215th/ 347
METRIC RANK
$100,656
MEDIAN FAMILY INCOME
26.3/ 100
METRIC RATING
194th/ 347
METRIC RANK
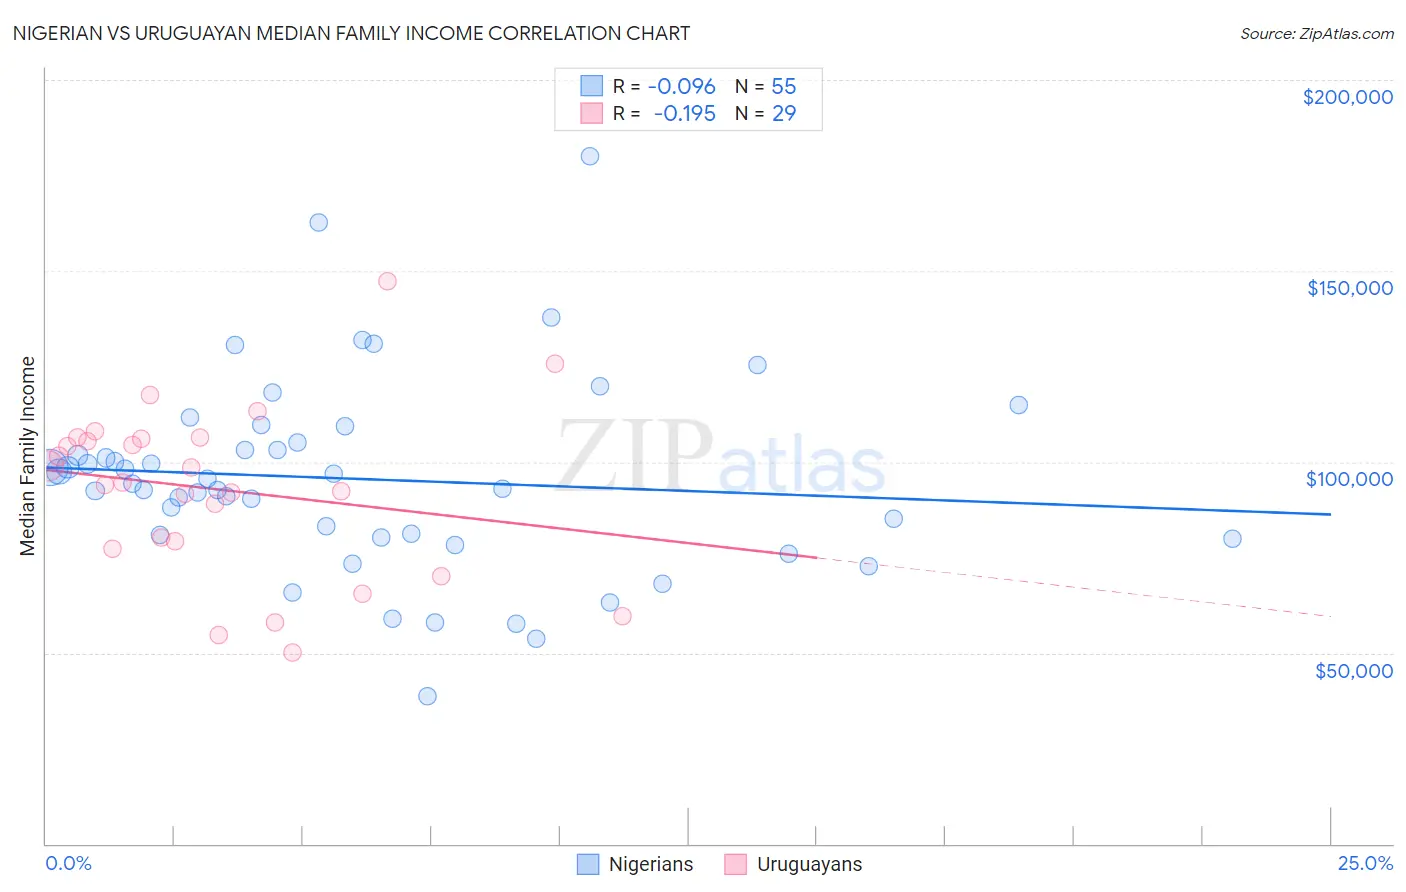
Nigerian vs Uruguayan Median Family Income Correlation Chart
The statistical analysis conducted on geographies consisting of 332,335,879 people shows a slight negative correlation between the proportion of Nigerians and median family income in the United States with a correlation coefficient (R) of -0.096 and weighted average of $97,522. Similarly, the statistical analysis conducted on geographies consisting of 144,757,564 people shows a poor negative correlation between the proportion of Uruguayans and median family income in the United States with a correlation coefficient (R) of -0.195 and weighted average of $100,656, a difference of 3.2%.
Median Family Income Correlation Summary
| Measurement | Nigerian | Uruguayan |
| Minimum | $38,750 | $50,000 |
| Maximum | $179,905 | $147,344 |
| Range | $141,155 | $97,344 |
| Mean | $95,484 | $92,799 |
| Median | $94,247 | $94,724 |
| Interquartile 25% (IQ1) | $80,166 | $78,231 |
| Interquartile 75% (IQ3) | $105,230 | $106,137 |
| Interquartile Range (IQR) | $25,063 | $27,906 |
| Standard Deviation (Sample) | $25,645 | $22,298 |
| Standard Deviation (Population) | $25,411 | $21,910 |
Similar Demographics by Median Family Income
Demographics Similar to Nigerians by Median Family Income
In terms of median family income, the demographic groups most similar to Nigerians are Bermudan ($97,577, a difference of 0.060%), Immigrants from Armenia ($97,605, a difference of 0.090%), Immigrants from Bosnia and Herzegovina ($97,432, a difference of 0.090%), Panamanian ($97,683, a difference of 0.17%), and Immigrants from Sudan ($97,737, a difference of 0.22%).
| Demographics | Rating | Rank | Median Family Income |
| Immigrants | Uruguay | 9.2 /100 | #208 | Tragic $98,205 |
| Immigrants | Colombia | 8.7 /100 | #209 | Tragic $98,067 |
| Puget Sound Salish | 8.2 /100 | #210 | Tragic $97,958 |
| Immigrants | Sudan | 7.4 /100 | #211 | Tragic $97,737 |
| Panamanians | 7.2 /100 | #212 | Tragic $97,683 |
| Immigrants | Armenia | 7.0 /100 | #213 | Tragic $97,605 |
| Bermudans | 6.9 /100 | #214 | Tragic $97,577 |
| Nigerians | 6.7 /100 | #215 | Tragic $97,522 |
| Immigrants | Bosnia and Herzegovina | 6.4 /100 | #216 | Tragic $97,432 |
| Japanese | 6.0 /100 | #217 | Tragic $97,288 |
| Immigrants | Cambodia | 5.8 /100 | #218 | Tragic $97,222 |
| Delaware | 5.1 /100 | #219 | Tragic $96,958 |
| Sudanese | 4.7 /100 | #220 | Tragic $96,783 |
| Immigrants | Ghana | 4.2 /100 | #221 | Tragic $96,544 |
| Immigrants | Nigeria | 4.0 /100 | #222 | Tragic $96,439 |
Demographics Similar to Uruguayans by Median Family Income
In terms of median family income, the demographic groups most similar to Uruguayans are Iraqi ($100,658, a difference of 0.0%), Immigrants from Kenya ($100,679, a difference of 0.020%), Colombian ($100,750, a difference of 0.090%), Immigrants from South America ($100,414, a difference of 0.24%), and Immigrants ($100,962, a difference of 0.30%).
| Demographics | Rating | Rank | Median Family Income |
| Tlingit-Haida | 30.8 /100 | #187 | Fair $101,092 |
| Guamanians/Chamorros | 30.5 /100 | #188 | Fair $101,061 |
| Immigrants | Portugal | 29.6 /100 | #189 | Fair $100,984 |
| Immigrants | Immigrants | 29.4 /100 | #190 | Fair $100,962 |
| Colombians | 27.2 /100 | #191 | Fair $100,750 |
| Immigrants | Kenya | 26.5 /100 | #192 | Fair $100,679 |
| Iraqis | 26.3 /100 | #193 | Fair $100,658 |
| Uruguayans | 26.3 /100 | #194 | Fair $100,656 |
| Immigrants | South America | 23.9 /100 | #195 | Fair $100,414 |
| Samoans | 23.3 /100 | #196 | Fair $100,344 |
| Immigrants | Cameroon | 22.8 /100 | #197 | Fair $100,289 |
| Immigrants | Africa | 22.5 /100 | #198 | Fair $100,256 |
| Yugoslavians | 21.3 /100 | #199 | Fair $100,119 |
| Spanish | 20.1 /100 | #200 | Fair $99,977 |
| Immigrants | Thailand | 19.0 /100 | #201 | Poor $99,840 |