Immigrants from Denmark vs Serbian Householder Income Ages 45 - 64 years
COMPARE
Immigrants from Denmark
Serbian
Householder Income Ages 45 - 64 years
Householder Income Ages 45 - 64 years Comparison
Immigrants from Denmark
Serbians
$116,000
HOUSEHOLDER INCOME AGES 45 - 64 YEARS
100.0/ 100
METRIC RATING
34th/ 347
METRIC RANK
$103,522
HOUSEHOLDER INCOME AGES 45 - 64 YEARS
83.2/ 100
METRIC RATING
143rd/ 347
METRIC RANK
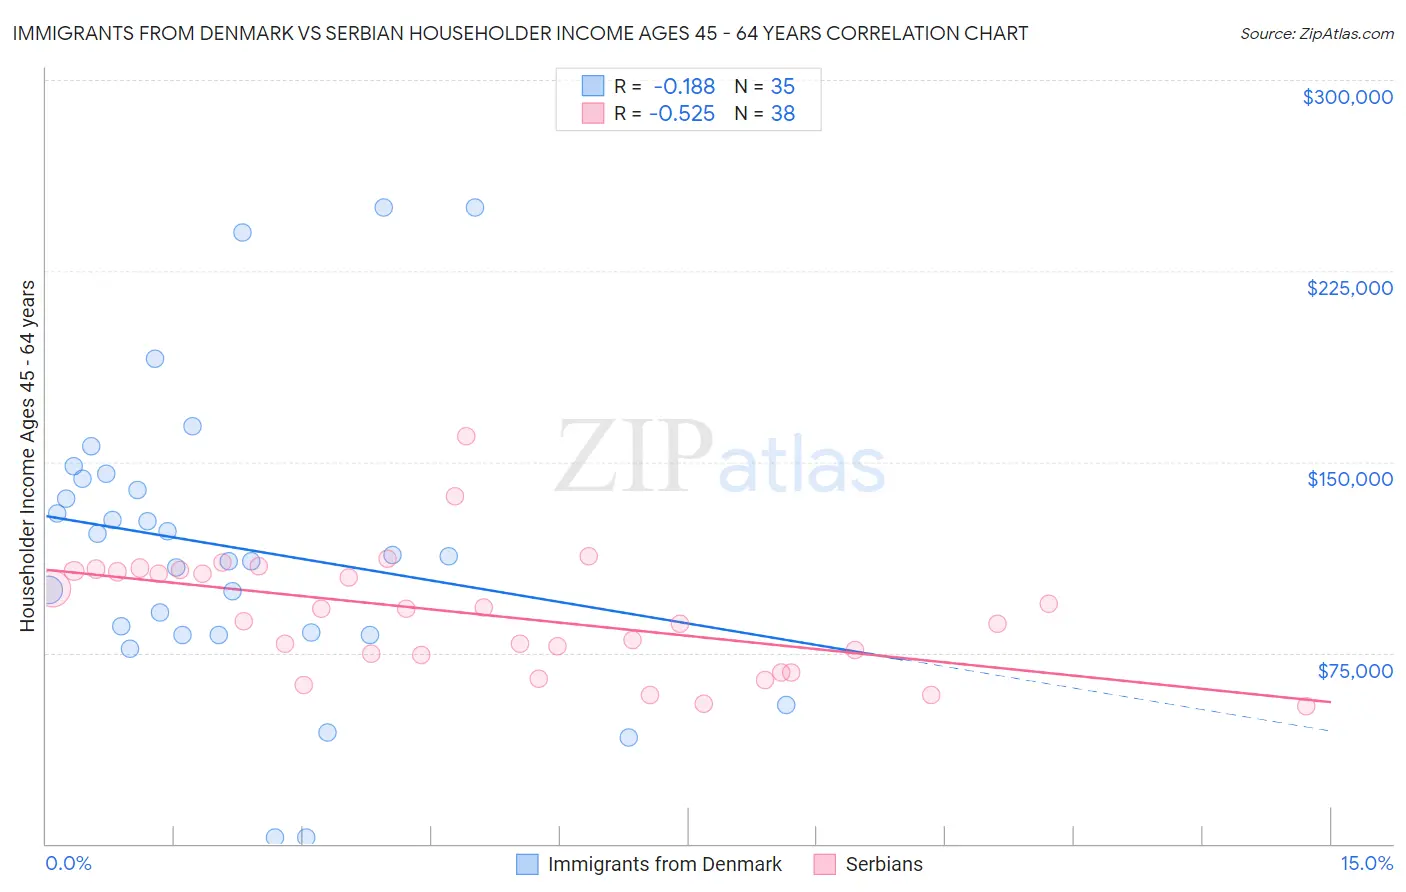
Immigrants from Denmark vs Serbian Householder Income Ages 45 - 64 years Correlation Chart
The statistical analysis conducted on geographies consisting of 136,366,596 people shows a poor negative correlation between the proportion of Immigrants from Denmark and household income with householder between the ages 45 and 64 in the United States with a correlation coefficient (R) of -0.188 and weighted average of $116,000. Similarly, the statistical analysis conducted on geographies consisting of 267,315,581 people shows a substantial negative correlation between the proportion of Serbians and household income with householder between the ages 45 and 64 in the United States with a correlation coefficient (R) of -0.525 and weighted average of $103,522, a difference of 12.0%.
Householder Income Ages 45 - 64 years Correlation Summary
| Measurement | Immigrants from Denmark | Serbian |
| Minimum | $2,499 | $53,958 |
| Maximum | $250,001 | $160,260 |
| Range | $247,502 | $106,302 |
| Mean | $116,363 | $89,963 |
| Median | $112,813 | $89,813 |
| Interquartile 25% (IQ1) | $81,964 | $74,285 |
| Interquartile 75% (IQ3) | $143,426 | $107,140 |
| Interquartile Range (IQR) | $61,462 | $32,855 |
| Standard Deviation (Sample) | $57,800 | $23,322 |
| Standard Deviation (Population) | $56,968 | $23,014 |
Similar Demographics by Householder Income Ages 45 - 64 years
Demographics Similar to Immigrants from Denmark by Householder Income Ages 45 - 64 years
In terms of householder income ages 45 - 64 years, the demographic groups most similar to Immigrants from Denmark are Latvian ($115,957, a difference of 0.040%), Immigrants from Switzerland ($115,934, a difference of 0.060%), Chinese ($116,156, a difference of 0.13%), Russian ($116,328, a difference of 0.28%), and Immigrants from Asia ($116,566, a difference of 0.49%).
| Demographics | Rating | Rank | Householder Income Ages 45 - 64 years |
| Immigrants | Northern Europe | 100.0 /100 | #27 | Exceptional $117,930 |
| Turks | 100.0 /100 | #28 | Exceptional $117,814 |
| Bhutanese | 100.0 /100 | #29 | Exceptional $117,750 |
| Immigrants | Bolivia | 100.0 /100 | #30 | Exceptional $117,731 |
| Immigrants | Asia | 100.0 /100 | #31 | Exceptional $116,566 |
| Russians | 100.0 /100 | #32 | Exceptional $116,328 |
| Chinese | 100.0 /100 | #33 | Exceptional $116,156 |
| Immigrants | Denmark | 100.0 /100 | #34 | Exceptional $116,000 |
| Latvians | 100.0 /100 | #35 | Exceptional $115,957 |
| Immigrants | Switzerland | 100.0 /100 | #36 | Exceptional $115,934 |
| Maltese | 99.9 /100 | #37 | Exceptional $114,754 |
| Immigrants | Pakistan | 99.9 /100 | #38 | Exceptional $114,434 |
| Immigrants | Turkey | 99.9 /100 | #39 | Exceptional $114,407 |
| Cambodians | 99.9 /100 | #40 | Exceptional $114,342 |
| Immigrants | Lithuania | 99.9 /100 | #41 | Exceptional $114,336 |
Demographics Similar to Serbians by Householder Income Ages 45 - 64 years
In terms of householder income ages 45 - 64 years, the demographic groups most similar to Serbians are Luxembourger ($103,536, a difference of 0.010%), Czech ($103,507, a difference of 0.010%), Ugandan ($103,472, a difference of 0.050%), Immigrants from Uganda ($103,584, a difference of 0.060%), and Immigrants from Chile ($103,412, a difference of 0.11%).
| Demographics | Rating | Rank | Householder Income Ages 45 - 64 years |
| Taiwanese | 87.4 /100 | #136 | Excellent $104,180 |
| Hungarians | 85.8 /100 | #137 | Excellent $103,913 |
| Ethiopians | 84.7 /100 | #138 | Excellent $103,736 |
| Immigrants | Oceania | 84.5 /100 | #139 | Excellent $103,705 |
| Norwegians | 84.3 /100 | #140 | Excellent $103,682 |
| Immigrants | Uganda | 83.7 /100 | #141 | Excellent $103,584 |
| Luxembourgers | 83.3 /100 | #142 | Excellent $103,536 |
| Serbians | 83.2 /100 | #143 | Excellent $103,522 |
| Czechs | 83.1 /100 | #144 | Excellent $103,507 |
| Ugandans | 82.9 /100 | #145 | Excellent $103,472 |
| Immigrants | Chile | 82.5 /100 | #146 | Excellent $103,412 |
| Basques | 82.3 /100 | #147 | Excellent $103,387 |
| Immigrants | Germany | 81.5 /100 | #148 | Excellent $103,282 |
| Immigrants | Sierra Leone | 81.1 /100 | #149 | Excellent $103,227 |
| Immigrants | Peru | 80.7 /100 | #150 | Excellent $103,173 |