Arab vs Serbian Householder Income Ages 45 - 64 years
COMPARE
Arab
Serbian
Householder Income Ages 45 - 64 years
Householder Income Ages 45 - 64 years Comparison
Arabs
Serbians
$104,566
HOUSEHOLDER INCOME AGES 45 - 64 YEARS
89.3/ 100
METRIC RATING
133rd/ 347
METRIC RANK
$103,522
HOUSEHOLDER INCOME AGES 45 - 64 YEARS
83.2/ 100
METRIC RATING
143rd/ 347
METRIC RANK
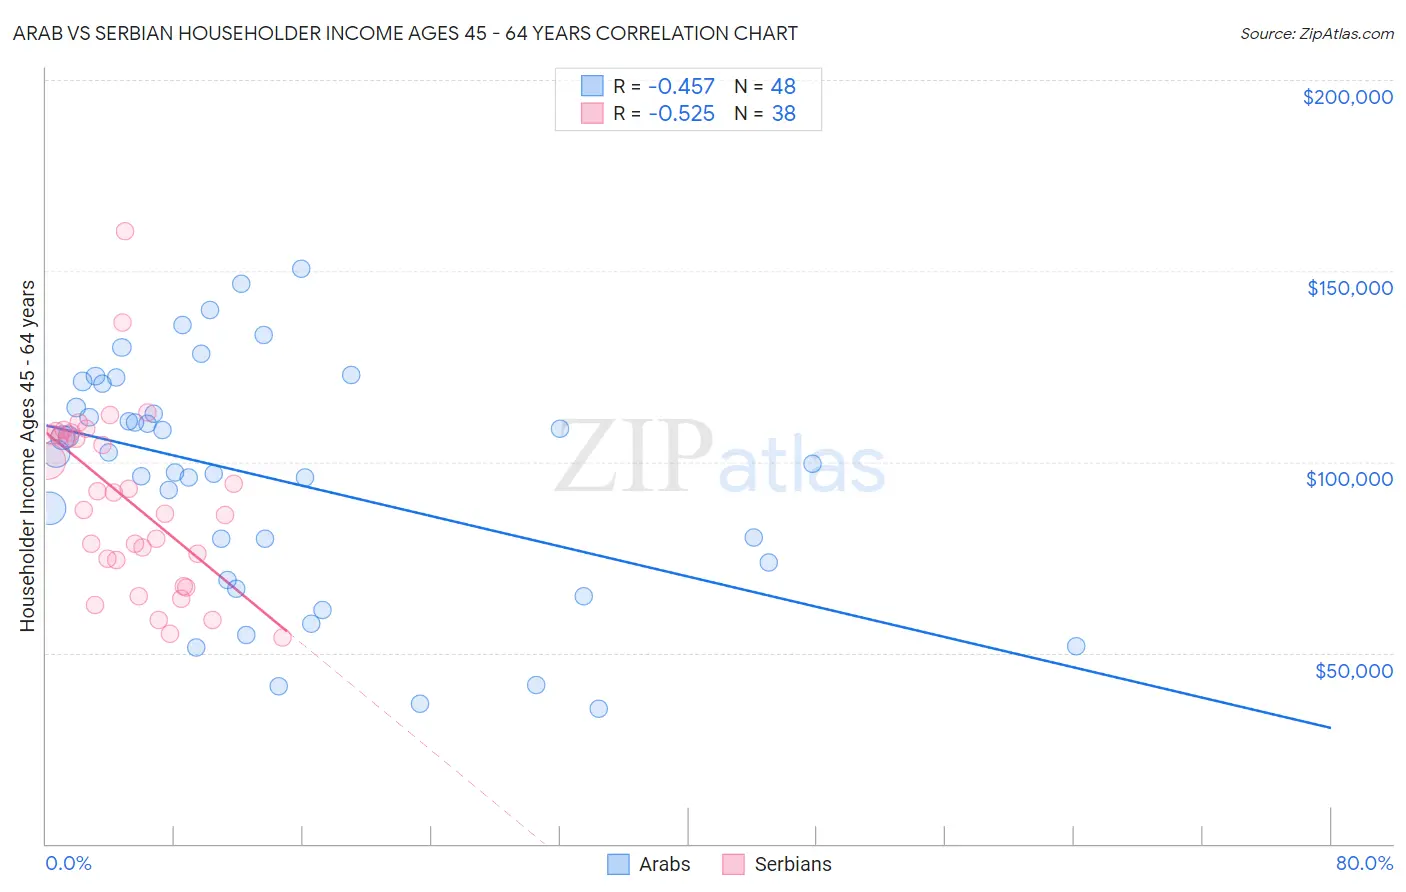
Arab vs Serbian Householder Income Ages 45 - 64 years Correlation Chart
The statistical analysis conducted on geographies consisting of 485,614,967 people shows a moderate negative correlation between the proportion of Arabs and household income with householder between the ages 45 and 64 in the United States with a correlation coefficient (R) of -0.457 and weighted average of $104,566. Similarly, the statistical analysis conducted on geographies consisting of 267,315,581 people shows a substantial negative correlation between the proportion of Serbians and household income with householder between the ages 45 and 64 in the United States with a correlation coefficient (R) of -0.525 and weighted average of $103,522, a difference of 1.0%.
Householder Income Ages 45 - 64 years Correlation Summary
| Measurement | Arab | Serbian |
| Minimum | $35,250 | $53,958 |
| Maximum | $150,539 | $160,260 |
| Range | $115,289 | $106,302 |
| Mean | $95,530 | $89,963 |
| Median | $100,868 | $89,813 |
| Interquartile 25% (IQ1) | $71,485 | $74,285 |
| Interquartile 75% (IQ3) | $117,419 | $107,140 |
| Interquartile Range (IQR) | $45,934 | $32,855 |
| Standard Deviation (Sample) | $30,403 | $23,322 |
| Standard Deviation (Population) | $30,085 | $23,014 |
Demographics Similar to Arabs and Serbians by Householder Income Ages 45 - 64 years
In terms of householder income ages 45 - 64 years, the demographic groups most similar to Arabs are Canadian ($104,560, a difference of 0.010%), Brazilian ($104,408, a difference of 0.15%), Lebanese ($104,734, a difference of 0.16%), Immigrants from Syria ($104,858, a difference of 0.28%), and Taiwanese ($104,180, a difference of 0.37%). Similarly, the demographic groups most similar to Serbians are Luxembourger ($103,536, a difference of 0.010%), Czech ($103,507, a difference of 0.010%), Ugandan ($103,472, a difference of 0.050%), Immigrants from Uganda ($103,584, a difference of 0.060%), and Immigrants from Chile ($103,412, a difference of 0.11%).
| Demographics | Rating | Rank | Householder Income Ages 45 - 64 years |
| Native Hawaiians | 91.8 /100 | #128 | Exceptional $105,149 |
| Peruvians | 91.5 /100 | #129 | Exceptional $105,070 |
| Immigrants | Zimbabwe | 91.2 /100 | #130 | Exceptional $104,992 |
| Immigrants | Syria | 90.7 /100 | #131 | Exceptional $104,858 |
| Lebanese | 90.1 /100 | #132 | Exceptional $104,734 |
| Arabs | 89.3 /100 | #133 | Excellent $104,566 |
| Canadians | 89.3 /100 | #134 | Excellent $104,560 |
| Brazilians | 88.6 /100 | #135 | Excellent $104,408 |
| Taiwanese | 87.4 /100 | #136 | Excellent $104,180 |
| Hungarians | 85.8 /100 | #137 | Excellent $103,913 |
| Ethiopians | 84.7 /100 | #138 | Excellent $103,736 |
| Immigrants | Oceania | 84.5 /100 | #139 | Excellent $103,705 |
| Norwegians | 84.3 /100 | #140 | Excellent $103,682 |
| Immigrants | Uganda | 83.7 /100 | #141 | Excellent $103,584 |
| Luxembourgers | 83.3 /100 | #142 | Excellent $103,536 |
| Serbians | 83.2 /100 | #143 | Excellent $103,522 |
| Czechs | 83.1 /100 | #144 | Excellent $103,507 |
| Ugandans | 82.9 /100 | #145 | Excellent $103,472 |
| Immigrants | Chile | 82.5 /100 | #146 | Excellent $103,412 |
| Basques | 82.3 /100 | #147 | Excellent $103,387 |
| Immigrants | Germany | 81.5 /100 | #148 | Excellent $103,282 |