Nicaraguan vs Immigrants from Western Africa Median Household Income
COMPARE
Nicaraguan
Immigrants from Western Africa
Median Household Income
Median Household Income Comparison
Nicaraguans
Immigrants from Western Africa
$79,737
MEDIAN HOUSEHOLD INCOME
3.1/ 100
METRIC RATING
237th/ 347
METRIC RANK
$79,490
MEDIAN HOUSEHOLD INCOME
2.7/ 100
METRIC RATING
240th/ 347
METRIC RANK
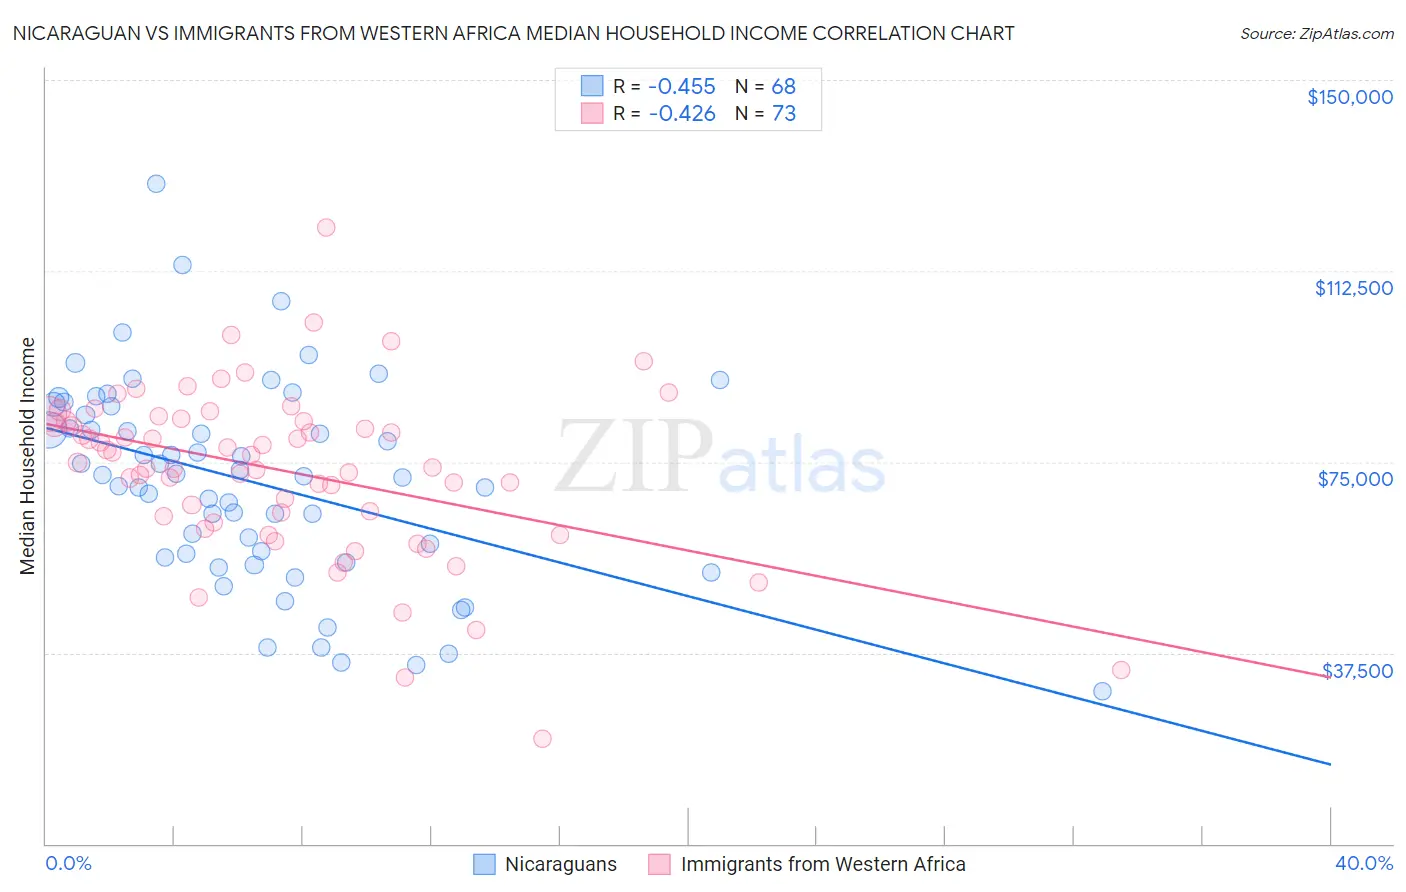
Nicaraguan vs Immigrants from Western Africa Median Household Income Correlation Chart
The statistical analysis conducted on geographies consisting of 285,567,751 people shows a moderate negative correlation between the proportion of Nicaraguans and median household income in the United States with a correlation coefficient (R) of -0.455 and weighted average of $79,737. Similarly, the statistical analysis conducted on geographies consisting of 357,459,311 people shows a moderate negative correlation between the proportion of Immigrants from Western Africa and median household income in the United States with a correlation coefficient (R) of -0.426 and weighted average of $79,490, a difference of 0.31%.
Median Household Income Correlation Summary
| Measurement | Nicaraguan | Immigrants from Western Africa |
| Minimum | $29,878 | $20,699 |
| Maximum | $129,595 | $120,953 |
| Range | $99,717 | $100,254 |
| Mean | $70,971 | $73,270 |
| Median | $72,218 | $74,855 |
| Interquartile 25% (IQ1) | $56,639 | $63,706 |
| Interquartile 75% (IQ3) | $85,047 | $83,237 |
| Interquartile Range (IQR) | $28,408 | $19,531 |
| Standard Deviation (Sample) | $19,770 | $16,693 |
| Standard Deviation (Population) | $19,624 | $16,579 |
Demographics Similar to Nicaraguans and Immigrants from Western Africa by Median Household Income
In terms of median household income, the demographic groups most similar to Nicaraguans are Barbadian ($79,664, a difference of 0.090%), Immigrants from Bosnia and Herzegovina ($79,888, a difference of 0.19%), Alaska Native ($79,509, a difference of 0.29%), Nonimmigrants ($79,429, a difference of 0.39%), and Immigrants from Guyana ($80,324, a difference of 0.74%). Similarly, the demographic groups most similar to Immigrants from Western Africa are Alaska Native ($79,509, a difference of 0.020%), Nonimmigrants ($79,429, a difference of 0.080%), Barbadian ($79,664, a difference of 0.22%), Immigrants from Sudan ($79,103, a difference of 0.49%), and Immigrants from Bosnia and Herzegovina ($79,888, a difference of 0.50%).
| Demographics | Rating | Rank | Median Household Income |
| Immigrants | Bangladesh | 5.7 /100 | #228 | Tragic $80,722 |
| Delaware | 5.0 /100 | #229 | Tragic $80,527 |
| Bermudans | 4.7 /100 | #230 | Tragic $80,406 |
| Trinidadians and Tobagonians | 4.7 /100 | #231 | Tragic $80,402 |
| Immigrants | Trinidad and Tobago | 4.6 /100 | #232 | Tragic $80,373 |
| Immigrants | Azores | 4.5 /100 | #233 | Tragic $80,357 |
| Immigrants | Ecuador | 4.5 /100 | #234 | Tragic $80,341 |
| Immigrants | Guyana | 4.5 /100 | #235 | Tragic $80,324 |
| Immigrants | Bosnia and Herzegovina | 3.4 /100 | #236 | Tragic $79,888 |
| Nicaraguans | 3.1 /100 | #237 | Tragic $79,737 |
| Barbadians | 3.0 /100 | #238 | Tragic $79,664 |
| Alaska Natives | 2.7 /100 | #239 | Tragic $79,509 |
| Immigrants | Western Africa | 2.7 /100 | #240 | Tragic $79,490 |
| Immigrants | Nonimmigrants | 2.6 /100 | #241 | Tragic $79,429 |
| Immigrants | Sudan | 2.1 /100 | #242 | Tragic $79,103 |
| Immigrants | Barbados | 1.9 /100 | #243 | Tragic $78,989 |
| Marshallese | 1.9 /100 | #244 | Tragic $78,930 |
| Inupiat | 1.8 /100 | #245 | Tragic $78,841 |
| Central Americans | 1.7 /100 | #246 | Tragic $78,803 |
| Immigrants | Burma/Myanmar | 1.6 /100 | #247 | Tragic $78,682 |
| Sudanese | 1.5 /100 | #248 | Tragic $78,529 |