Immigrants from Israel vs Immigrants from Western Africa Median Household Income
COMPARE
Immigrants from Israel
Immigrants from Western Africa
Median Household Income
Median Household Income Comparison
Immigrants from Israel
Immigrants from Western Africa
$104,090
MEDIAN HOUSEHOLD INCOME
100.0/ 100
METRIC RATING
15th/ 347
METRIC RANK
$79,490
MEDIAN HOUSEHOLD INCOME
2.7/ 100
METRIC RATING
240th/ 347
METRIC RANK
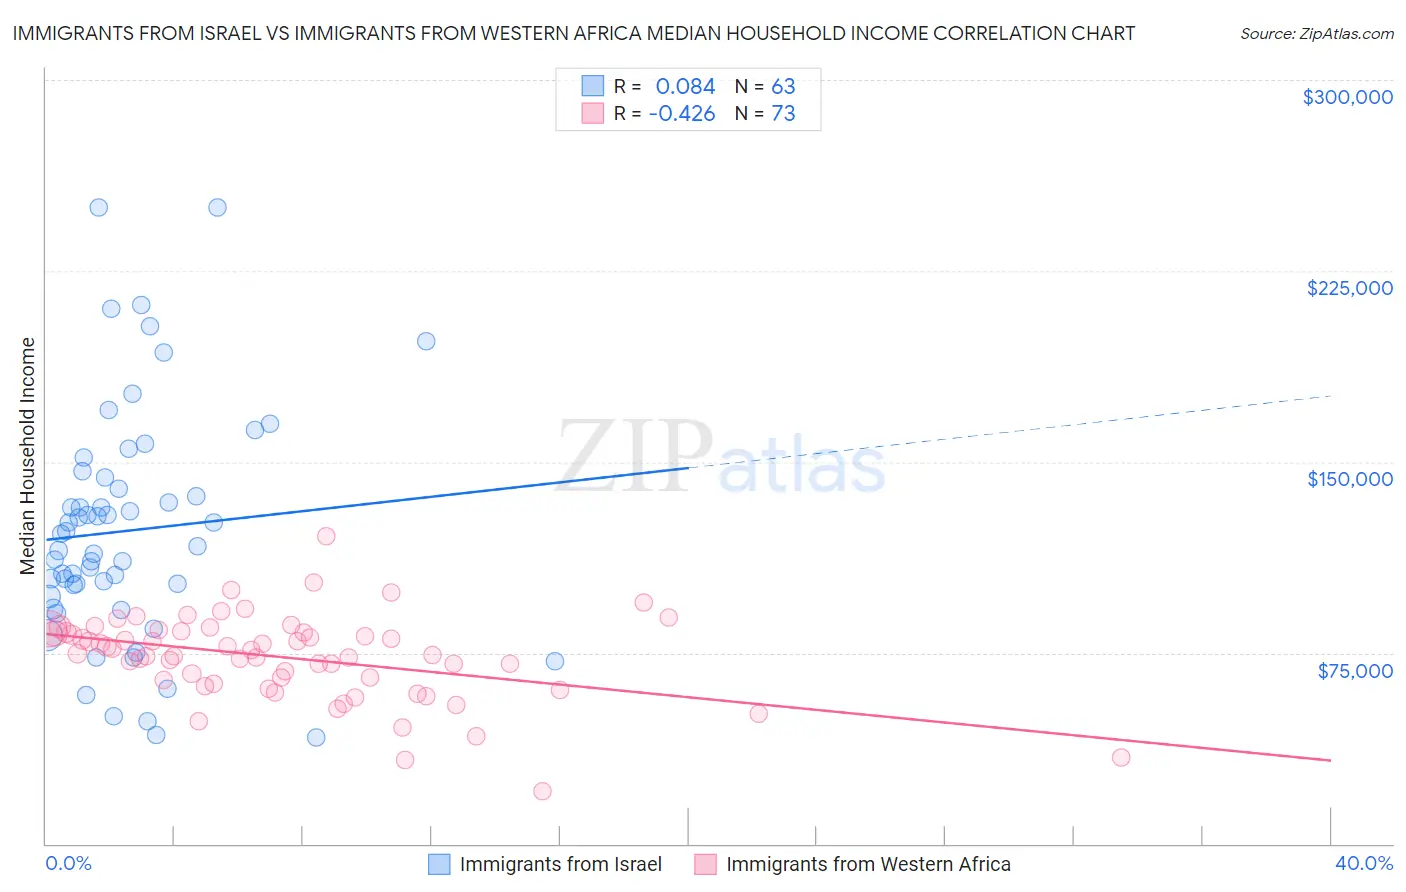
Immigrants from Israel vs Immigrants from Western Africa Median Household Income Correlation Chart
The statistical analysis conducted on geographies consisting of 209,966,745 people shows a slight positive correlation between the proportion of Immigrants from Israel and median household income in the United States with a correlation coefficient (R) of 0.084 and weighted average of $104,090. Similarly, the statistical analysis conducted on geographies consisting of 357,459,311 people shows a moderate negative correlation between the proportion of Immigrants from Western Africa and median household income in the United States with a correlation coefficient (R) of -0.426 and weighted average of $79,490, a difference of 30.9%.
Median Household Income Correlation Summary
| Measurement | Immigrants from Israel | Immigrants from Western Africa |
| Minimum | $41,875 | $20,699 |
| Maximum | $250,001 | $120,953 |
| Range | $208,126 | $100,254 |
| Mean | $123,014 | $73,270 |
| Median | $116,644 | $74,855 |
| Interquartile 25% (IQ1) | $97,035 | $63,706 |
| Interquartile 75% (IQ3) | $143,680 | $83,237 |
| Interquartile Range (IQR) | $46,645 | $19,531 |
| Standard Deviation (Sample) | $45,941 | $16,693 |
| Standard Deviation (Population) | $45,575 | $16,579 |
Similar Demographics by Median Household Income
Demographics Similar to Immigrants from Israel by Median Household Income
In terms of median household income, the demographic groups most similar to Immigrants from Israel are Immigrants from Ireland ($104,692, a difference of 0.58%), Immigrants from Eastern Asia ($104,796, a difference of 0.68%), Burmese ($103,145, a difference of 0.92%), Immigrants from Korea ($102,962, a difference of 1.1%), and Indian (Asian) ($105,262, a difference of 1.1%).
| Demographics | Rating | Rank | Median Household Income |
| Immigrants | Iran | 100.0 /100 | #8 | Exceptional $108,055 |
| Okinawans | 100.0 /100 | #9 | Exceptional $106,624 |
| Immigrants | South Central Asia | 100.0 /100 | #10 | Exceptional $106,057 |
| Immigrants | China | 100.0 /100 | #11 | Exceptional $105,335 |
| Indians (Asian) | 100.0 /100 | #12 | Exceptional $105,262 |
| Immigrants | Eastern Asia | 100.0 /100 | #13 | Exceptional $104,796 |
| Immigrants | Ireland | 100.0 /100 | #14 | Exceptional $104,692 |
| Immigrants | Israel | 100.0 /100 | #15 | Exceptional $104,090 |
| Burmese | 100.0 /100 | #16 | Exceptional $103,145 |
| Immigrants | Korea | 100.0 /100 | #17 | Exceptional $102,962 |
| Cypriots | 100.0 /100 | #18 | Exceptional $102,843 |
| Immigrants | Australia | 100.0 /100 | #19 | Exceptional $102,562 |
| Bolivians | 100.0 /100 | #20 | Exceptional $102,195 |
| Eastern Europeans | 100.0 /100 | #21 | Exceptional $101,781 |
| Asians | 100.0 /100 | #22 | Exceptional $101,681 |
Demographics Similar to Immigrants from Western Africa by Median Household Income
In terms of median household income, the demographic groups most similar to Immigrants from Western Africa are Alaska Native ($79,509, a difference of 0.020%), Nonimmigrants ($79,429, a difference of 0.080%), Barbadian ($79,664, a difference of 0.22%), Nicaraguan ($79,737, a difference of 0.31%), and Immigrants from Sudan ($79,103, a difference of 0.49%).
| Demographics | Rating | Rank | Median Household Income |
| Immigrants | Azores | 4.5 /100 | #233 | Tragic $80,357 |
| Immigrants | Ecuador | 4.5 /100 | #234 | Tragic $80,341 |
| Immigrants | Guyana | 4.5 /100 | #235 | Tragic $80,324 |
| Immigrants | Bosnia and Herzegovina | 3.4 /100 | #236 | Tragic $79,888 |
| Nicaraguans | 3.1 /100 | #237 | Tragic $79,737 |
| Barbadians | 3.0 /100 | #238 | Tragic $79,664 |
| Alaska Natives | 2.7 /100 | #239 | Tragic $79,509 |
| Immigrants | Western Africa | 2.7 /100 | #240 | Tragic $79,490 |
| Immigrants | Nonimmigrants | 2.6 /100 | #241 | Tragic $79,429 |
| Immigrants | Sudan | 2.1 /100 | #242 | Tragic $79,103 |
| Immigrants | Barbados | 1.9 /100 | #243 | Tragic $78,989 |
| Marshallese | 1.9 /100 | #244 | Tragic $78,930 |
| Inupiat | 1.8 /100 | #245 | Tragic $78,841 |
| Central Americans | 1.7 /100 | #246 | Tragic $78,803 |
| Immigrants | Burma/Myanmar | 1.6 /100 | #247 | Tragic $78,682 |