Jamaican vs Immigrants from Western Africa Median Household Income
COMPARE
Jamaican
Immigrants from Western Africa
Median Household Income
Median Household Income Comparison
Jamaicans
Immigrants from Western Africa
$76,583
MEDIAN HOUSEHOLD INCOME
0.4/ 100
METRIC RATING
260th/ 347
METRIC RANK
$79,490
MEDIAN HOUSEHOLD INCOME
2.7/ 100
METRIC RATING
240th/ 347
METRIC RANK
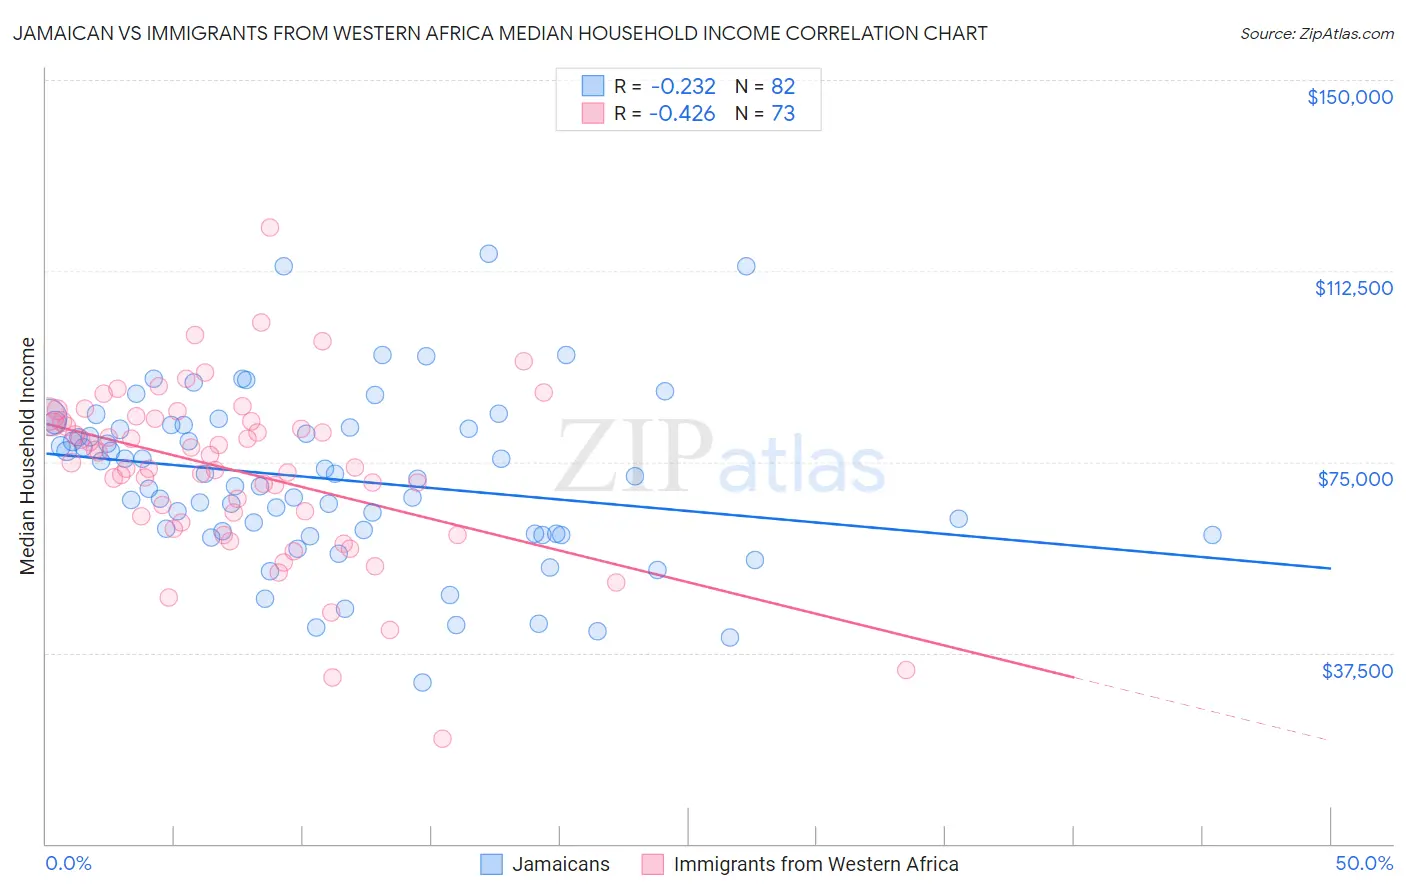
Jamaican vs Immigrants from Western Africa Median Household Income Correlation Chart
The statistical analysis conducted on geographies consisting of 367,555,449 people shows a weak negative correlation between the proportion of Jamaicans and median household income in the United States with a correlation coefficient (R) of -0.232 and weighted average of $76,583. Similarly, the statistical analysis conducted on geographies consisting of 357,459,311 people shows a moderate negative correlation between the proportion of Immigrants from Western Africa and median household income in the United States with a correlation coefficient (R) of -0.426 and weighted average of $79,490, a difference of 3.8%.
Median Household Income Correlation Summary
| Measurement | Jamaican | Immigrants from Western Africa |
| Minimum | $31,580 | $20,699 |
| Maximum | $115,872 | $120,953 |
| Range | $84,292 | $100,254 |
| Mean | $71,605 | $73,270 |
| Median | $71,865 | $74,855 |
| Interquartile 25% (IQ1) | $60,801 | $63,706 |
| Interquartile 75% (IQ3) | $81,812 | $83,237 |
| Interquartile Range (IQR) | $21,011 | $19,531 |
| Standard Deviation (Sample) | $16,569 | $16,693 |
| Standard Deviation (Population) | $16,468 | $16,579 |
Demographics Similar to Jamaicans and Immigrants from Western Africa by Median Household Income
In terms of median household income, the demographic groups most similar to Jamaicans are Spanish American Indian ($76,670, a difference of 0.11%), Immigrants from Nicaragua ($76,784, a difference of 0.26%), Immigrants from Senegal ($76,915, a difference of 0.43%), Belizean ($77,028, a difference of 0.58%), and Immigrants from Middle Africa ($77,559, a difference of 1.3%). Similarly, the demographic groups most similar to Immigrants from Western Africa are Nonimmigrants ($79,429, a difference of 0.080%), Immigrants from Sudan ($79,103, a difference of 0.49%), Immigrants from Barbados ($78,989, a difference of 0.63%), Marshallese ($78,930, a difference of 0.71%), and Inupiat ($78,841, a difference of 0.82%).
| Demographics | Rating | Rank | Median Household Income |
| Immigrants | Western Africa | 2.7 /100 | #240 | Tragic $79,490 |
| Immigrants | Nonimmigrants | 2.6 /100 | #241 | Tragic $79,429 |
| Immigrants | Sudan | 2.1 /100 | #242 | Tragic $79,103 |
| Immigrants | Barbados | 1.9 /100 | #243 | Tragic $78,989 |
| Marshallese | 1.9 /100 | #244 | Tragic $78,930 |
| Inupiat | 1.8 /100 | #245 | Tragic $78,841 |
| Central Americans | 1.7 /100 | #246 | Tragic $78,803 |
| Immigrants | Burma/Myanmar | 1.6 /100 | #247 | Tragic $78,682 |
| Sudanese | 1.5 /100 | #248 | Tragic $78,529 |
| West Indians | 1.4 /100 | #249 | Tragic $78,455 |
| Immigrants | Laos | 1.3 /100 | #250 | Tragic $78,327 |
| Mexican American Indians | 1.2 /100 | #251 | Tragic $78,166 |
| Immigrants | West Indies | 1.0 /100 | #252 | Tragic $77,956 |
| Immigrants | St. Vincent and the Grenadines | 0.9 /100 | #253 | Tragic $77,690 |
| Sub-Saharan Africans | 0.8 /100 | #254 | Tragic $77,631 |
| Immigrants | Middle Africa | 0.8 /100 | #255 | Tragic $77,559 |
| Belizeans | 0.6 /100 | #256 | Tragic $77,028 |
| Immigrants | Senegal | 0.5 /100 | #257 | Tragic $76,915 |
| Immigrants | Nicaragua | 0.5 /100 | #258 | Tragic $76,784 |
| Spanish American Indians | 0.4 /100 | #259 | Tragic $76,670 |
| Jamaicans | 0.4 /100 | #260 | Tragic $76,583 |