Nicaraguan vs Immigrants from Oceania Median Household Income
COMPARE
Nicaraguan
Immigrants from Oceania
Median Household Income
Median Household Income Comparison
Nicaraguans
Immigrants from Oceania
$79,737
MEDIAN HOUSEHOLD INCOME
3.1/ 100
METRIC RATING
237th/ 347
METRIC RANK
$89,100
MEDIAN HOUSEHOLD INCOME
92.9/ 100
METRIC RATING
126th/ 347
METRIC RANK
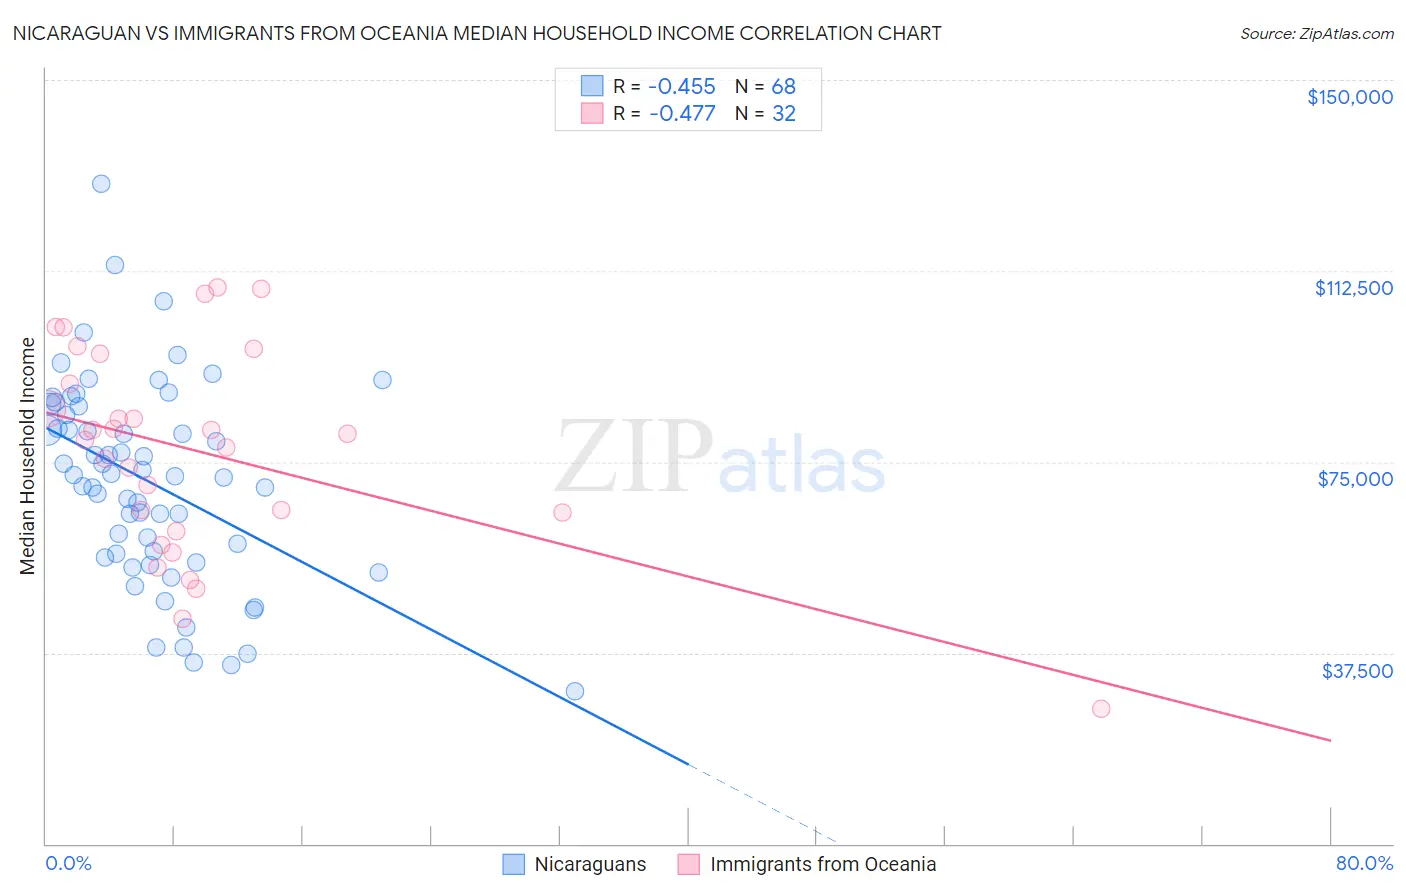
Nicaraguan vs Immigrants from Oceania Median Household Income Correlation Chart
The statistical analysis conducted on geographies consisting of 285,567,751 people shows a moderate negative correlation between the proportion of Nicaraguans and median household income in the United States with a correlation coefficient (R) of -0.455 and weighted average of $79,737. Similarly, the statistical analysis conducted on geographies consisting of 305,340,910 people shows a moderate negative correlation between the proportion of Immigrants from Oceania and median household income in the United States with a correlation coefficient (R) of -0.477 and weighted average of $89,100, a difference of 11.7%.
Median Household Income Correlation Summary
| Measurement | Nicaraguan | Immigrants from Oceania |
| Minimum | $29,878 | $26,558 |
| Maximum | $129,595 | $109,241 |
| Range | $99,717 | $82,683 |
| Mean | $70,971 | $77,019 |
| Median | $72,218 | $80,011 |
| Interquartile 25% (IQ1) | $56,639 | $63,155 |
| Interquartile 75% (IQ3) | $85,047 | $93,329 |
| Interquartile Range (IQR) | $28,408 | $30,174 |
| Standard Deviation (Sample) | $19,770 | $20,295 |
| Standard Deviation (Population) | $19,624 | $19,975 |
Similar Demographics by Median Household Income
Demographics Similar to Nicaraguans by Median Household Income
In terms of median household income, the demographic groups most similar to Nicaraguans are Barbadian ($79,664, a difference of 0.090%), Immigrants from Bosnia and Herzegovina ($79,888, a difference of 0.19%), Alaska Native ($79,509, a difference of 0.29%), Immigrants from Western Africa ($79,490, a difference of 0.31%), and Nonimmigrants ($79,429, a difference of 0.39%).
| Demographics | Rating | Rank | Median Household Income |
| Bermudans | 4.7 /100 | #230 | Tragic $80,406 |
| Trinidadians and Tobagonians | 4.7 /100 | #231 | Tragic $80,402 |
| Immigrants | Trinidad and Tobago | 4.6 /100 | #232 | Tragic $80,373 |
| Immigrants | Azores | 4.5 /100 | #233 | Tragic $80,357 |
| Immigrants | Ecuador | 4.5 /100 | #234 | Tragic $80,341 |
| Immigrants | Guyana | 4.5 /100 | #235 | Tragic $80,324 |
| Immigrants | Bosnia and Herzegovina | 3.4 /100 | #236 | Tragic $79,888 |
| Nicaraguans | 3.1 /100 | #237 | Tragic $79,737 |
| Barbadians | 3.0 /100 | #238 | Tragic $79,664 |
| Alaska Natives | 2.7 /100 | #239 | Tragic $79,509 |
| Immigrants | Western Africa | 2.7 /100 | #240 | Tragic $79,490 |
| Immigrants | Nonimmigrants | 2.6 /100 | #241 | Tragic $79,429 |
| Immigrants | Sudan | 2.1 /100 | #242 | Tragic $79,103 |
| Immigrants | Barbados | 1.9 /100 | #243 | Tragic $78,989 |
| Marshallese | 1.9 /100 | #244 | Tragic $78,930 |
Demographics Similar to Immigrants from Oceania by Median Household Income
In terms of median household income, the demographic groups most similar to Immigrants from Oceania are Immigrants from Peru ($89,010, a difference of 0.10%), Portuguese ($88,976, a difference of 0.14%), Immigrants from Kuwait ($89,263, a difference of 0.18%), Brazilian ($88,934, a difference of 0.19%), and British ($88,914, a difference of 0.21%).
| Demographics | Rating | Rank | Median Household Income |
| Albanians | 95.2 /100 | #119 | Exceptional $89,744 |
| Immigrants | North Macedonia | 95.2 /100 | #120 | Exceptional $89,741 |
| Ethiopians | 94.9 /100 | #121 | Exceptional $89,640 |
| Pakistanis | 94.8 /100 | #122 | Exceptional $89,638 |
| Immigrants | Zimbabwe | 94.4 /100 | #123 | Exceptional $89,496 |
| Immigrants | Jordan | 94.1 /100 | #124 | Exceptional $89,412 |
| Immigrants | Kuwait | 93.5 /100 | #125 | Exceptional $89,263 |
| Immigrants | Oceania | 92.9 /100 | #126 | Exceptional $89,100 |
| Immigrants | Peru | 92.5 /100 | #127 | Exceptional $89,010 |
| Portuguese | 92.3 /100 | #128 | Exceptional $88,976 |
| Brazilians | 92.1 /100 | #129 | Exceptional $88,934 |
| British | 92.0 /100 | #130 | Exceptional $88,914 |
| Immigrants | Syria | 91.4 /100 | #131 | Exceptional $88,792 |
| Europeans | 91.2 /100 | #132 | Exceptional $88,751 |
| Immigrants | Ethiopia | 90.9 /100 | #133 | Exceptional $88,687 |