Nicaraguan vs Costa Rican Median Household Income
COMPARE
Nicaraguan
Costa Rican
Median Household Income
Median Household Income Comparison
Nicaraguans
Costa Ricans
$79,737
MEDIAN HOUSEHOLD INCOME
3.1/ 100
METRIC RATING
237th/ 347
METRIC RANK
$87,262
MEDIAN HOUSEHOLD INCOME
80.0/ 100
METRIC RATING
148th/ 347
METRIC RANK
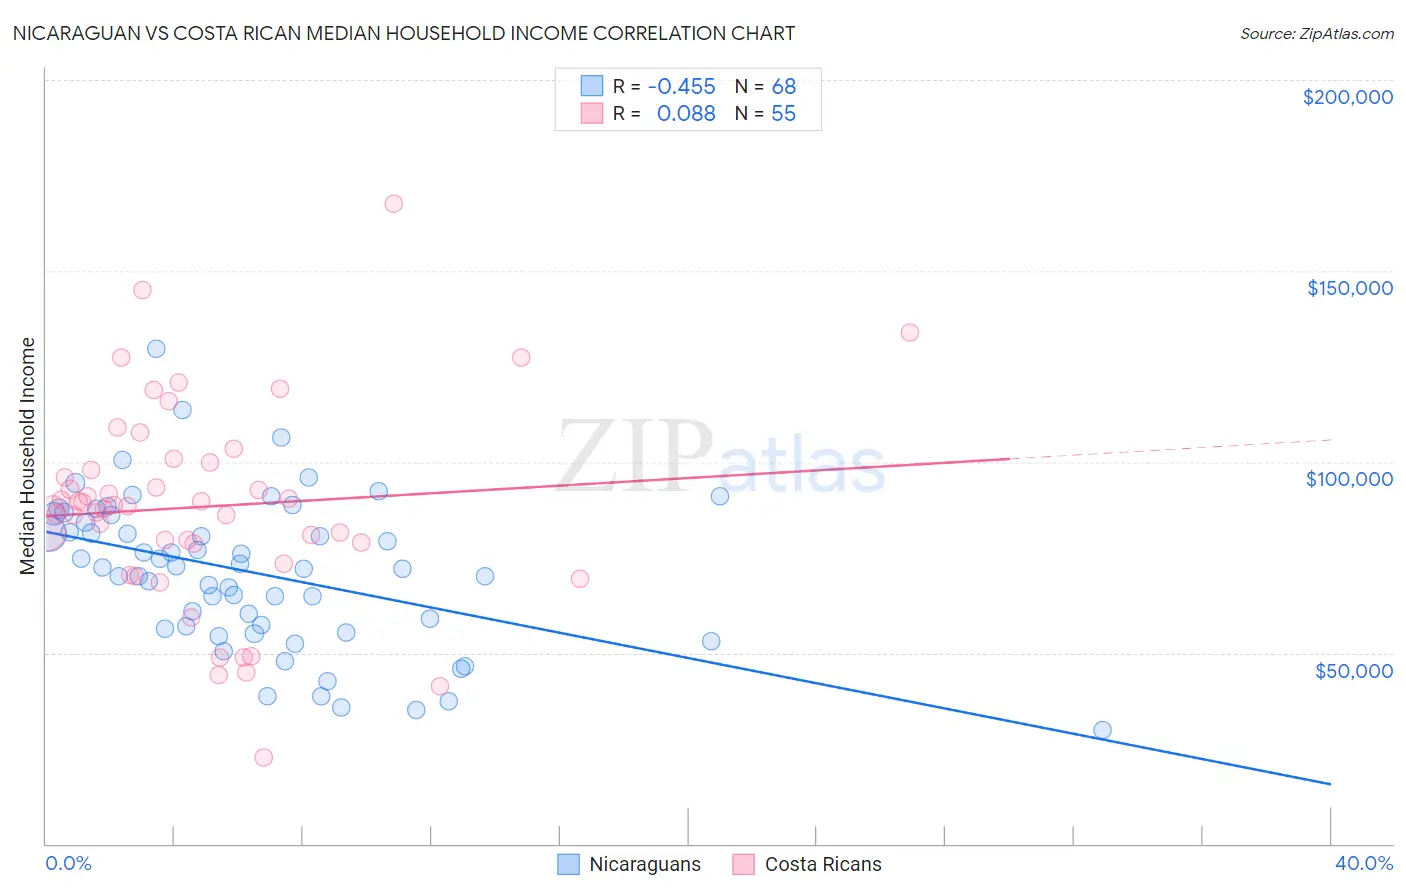
Nicaraguan vs Costa Rican Median Household Income Correlation Chart
The statistical analysis conducted on geographies consisting of 285,567,751 people shows a moderate negative correlation between the proportion of Nicaraguans and median household income in the United States with a correlation coefficient (R) of -0.455 and weighted average of $79,737. Similarly, the statistical analysis conducted on geographies consisting of 253,413,856 people shows a slight positive correlation between the proportion of Costa Ricans and median household income in the United States with a correlation coefficient (R) of 0.088 and weighted average of $87,262, a difference of 9.4%.
Median Household Income Correlation Summary
| Measurement | Nicaraguan | Costa Rican |
| Minimum | $29,878 | $22,708 |
| Maximum | $129,595 | $167,647 |
| Range | $99,717 | $144,939 |
| Mean | $70,971 | $88,260 |
| Median | $72,218 | $88,335 |
| Interquartile 25% (IQ1) | $56,639 | $78,591 |
| Interquartile 75% (IQ3) | $85,047 | $99,928 |
| Interquartile Range (IQR) | $28,408 | $21,337 |
| Standard Deviation (Sample) | $19,770 | $26,495 |
| Standard Deviation (Population) | $19,624 | $26,253 |
Similar Demographics by Median Household Income
Demographics Similar to Nicaraguans by Median Household Income
In terms of median household income, the demographic groups most similar to Nicaraguans are Barbadian ($79,664, a difference of 0.090%), Immigrants from Bosnia and Herzegovina ($79,888, a difference of 0.19%), Alaska Native ($79,509, a difference of 0.29%), Immigrants from Western Africa ($79,490, a difference of 0.31%), and Nonimmigrants ($79,429, a difference of 0.39%).
| Demographics | Rating | Rank | Median Household Income |
| Bermudans | 4.7 /100 | #230 | Tragic $80,406 |
| Trinidadians and Tobagonians | 4.7 /100 | #231 | Tragic $80,402 |
| Immigrants | Trinidad and Tobago | 4.6 /100 | #232 | Tragic $80,373 |
| Immigrants | Azores | 4.5 /100 | #233 | Tragic $80,357 |
| Immigrants | Ecuador | 4.5 /100 | #234 | Tragic $80,341 |
| Immigrants | Guyana | 4.5 /100 | #235 | Tragic $80,324 |
| Immigrants | Bosnia and Herzegovina | 3.4 /100 | #236 | Tragic $79,888 |
| Nicaraguans | 3.1 /100 | #237 | Tragic $79,737 |
| Barbadians | 3.0 /100 | #238 | Tragic $79,664 |
| Alaska Natives | 2.7 /100 | #239 | Tragic $79,509 |
| Immigrants | Western Africa | 2.7 /100 | #240 | Tragic $79,490 |
| Immigrants | Nonimmigrants | 2.6 /100 | #241 | Tragic $79,429 |
| Immigrants | Sudan | 2.1 /100 | #242 | Tragic $79,103 |
| Immigrants | Barbados | 1.9 /100 | #243 | Tragic $78,989 |
| Marshallese | 1.9 /100 | #244 | Tragic $78,930 |
Demographics Similar to Costa Ricans by Median Household Income
In terms of median household income, the demographic groups most similar to Costa Ricans are South American Indian ($87,446, a difference of 0.21%), Immigrants from Nepal ($87,046, a difference of 0.25%), Basque ($87,001, a difference of 0.30%), Immigrants from Uganda ($87,553, a difference of 0.33%), and Ugandan ($87,557, a difference of 0.34%).
| Demographics | Rating | Rank | Median Household Income |
| Immigrants | Morocco | 86.0 /100 | #141 | Excellent $87,930 |
| Canadians | 84.7 /100 | #142 | Excellent $87,769 |
| Danes | 83.9 /100 | #143 | Excellent $87,676 |
| Serbians | 83.0 /100 | #144 | Excellent $87,572 |
| Ugandans | 82.9 /100 | #145 | Excellent $87,557 |
| Immigrants | Uganda | 82.8 /100 | #146 | Excellent $87,553 |
| South American Indians | 81.8 /100 | #147 | Excellent $87,446 |
| Costa Ricans | 80.0 /100 | #148 | Excellent $87,262 |
| Immigrants | Nepal | 77.7 /100 | #149 | Good $87,046 |
| Basques | 77.2 /100 | #150 | Good $87,001 |
| Hungarians | 76.3 /100 | #151 | Good $86,920 |
| Immigrants | Saudi Arabia | 75.8 /100 | #152 | Good $86,875 |
| South Americans | 75.1 /100 | #153 | Good $86,824 |
| Immigrants | Germany | 74.4 /100 | #154 | Good $86,764 |
| Carpatho Rusyns | 72.8 /100 | #155 | Good $86,635 |